WorldArrow icon
Arrow iconCalgary

Air quality in Calgary

Air quality index (AQI⁺) and PM2.5 air pollution in Calgary • 309.1K Followers • 06:00, Nov 17 Local time

26

US AQI⁺

Good

face expression based on aqi value

Main pollutant:

NO₂

52.6 µg/m³

weather condition icon

0°

wind direction icon

8 km/h

weather humid icon

60 %

Hourly forecast

Calgary air quality index (AQI⁺) forecast

Now

26

Weather icon

0°

IQAir AirVisual Air Quality Map Wind rotating 307 degree

8

km/h

Humidity icon

60%

08:00

25

Weather icon

-1°

IQAir AirVisual Air Quality Map Wind rotating 284 degree

7

km/h

Humidity icon

63%

09:00

24

Weather icon

0°

IQAir AirVisual Air Quality Map Wind rotating 305 degree

9

km/h

Humidity icon

62%

10:00

23

Weather icon

0°

IQAir AirVisual Air Quality Map Wind rotating 309 degree

8

km/h

Humidity icon

61%

11:00

22

Weather icon

1°

IQAir AirVisual Air Quality Map Wind rotating 319 degree

5

km/h

Humidity icon

54%

12:00

18

Weather icon

2°

IQAir AirVisual Air Quality Map Wind rotating 323 degree

4

km/h

Humidity icon

48%

13:00

16

Weather icon

3°

IQAir AirVisual Air Quality Map Wind rotating 18 degree

2

km/h

Humidity icon

44%

14:00

15

Weather icon

4°

IQAir AirVisual Air Quality Map Wind rotating 55 degree

5

km/h

Humidity icon

43%

15:00

11

Weather icon

4°

IQAir AirVisual Air Quality Map Wind rotating 79 degree

4

km/h

Humidity icon

44%

16:00

9

Weather icon

4°

IQAir AirVisual Air Quality Map Wind rotating 76 degree

7

km/h

Humidity icon

47%

17:00

8

Weather icon

3°

IQAir AirVisual Air Quality Map Wind rotating 85 degree

8

km/h

Humidity icon

54%

18:00

8

Weather icon

2°

IQAir AirVisual Air Quality Map Wind rotating 95 degree

9

km/h

Humidity icon

60%

19:00

8

Weather icon

2°

IQAir AirVisual Air Quality Map Wind rotating 111 degree

7

km/h

Humidity icon

62%

20:00

8

Weather icon

1°

IQAir AirVisual Air Quality Map Wind rotating 114 degree

6

km/h

Humidity icon

75%

21:00

12

Weather icon

80%

0°

IQAir AirVisual Air Quality Map Wind rotating 8 degree

4

km/h

Humidity icon

97%

22:00

12

Weather icon

90%

0°

IQAir AirVisual Air Quality Map Wind rotating 355 degree

8

km/h

Humidity icon

97%

23:00

12

Weather icon

80%

0°

IQAir AirVisual Air Quality Map Wind rotating 358 degree

8

km/h

Humidity icon

98%

Wed

00:00

8

Weather icon

0°

IQAir AirVisual Air Quality Map Wind rotating 12 degree

10

km/h

Humidity icon

99%

01:00

8

Weather icon

70%

0°

IQAir AirVisual Air Quality Map Wind rotating 14 degree

10

km/h

Humidity icon

99%

02:00

8

Weather icon

0°

IQAir AirVisual Air Quality Map Wind rotating 17 degree

11

km/h

Humidity icon

98%

03:00

8

Weather icon

0°

IQAir AirVisual Air Quality Map Wind rotating 18 degree

12

km/h

Humidity icon

98%

04:00

8

Weather icon

0°

IQAir AirVisual Air Quality Map Wind rotating 12 degree

10

km/h

Humidity icon

98%

05:00

8

Weather icon

-1°

IQAir AirVisual Air Quality Map Wind rotating 13 degree

8

km/h

Humidity icon

98%

06:00

8

Weather icon

0°

IQAir AirVisual Air Quality Map Wind rotating 16 degree

6

km/h

Humidity icon

99%

07:00

8

Weather icon

0°

IQAir AirVisual Air Quality Map Wind rotating 6 degree

5

km/h

Humidity icon

99%

08:00

8

Weather icon

0°

IQAir AirVisual Air Quality Map Wind rotating 2 degree

5

km/h

Humidity icon

99%

09:00

13

Weather icon

0°

IQAir AirVisual Air Quality Map Wind rotating 16 degree

6

km/h

Humidity icon

99%

10:00

13

Weather icon

0°

IQAir AirVisual Air Quality Map Wind rotating 12 degree

6

km/h

Humidity icon

99%

11:00

13

Weather icon

0°

IQAir AirVisual Air Quality Map Wind rotating 15 degree

8

km/h

Humidity icon

99%

12:00

14

Weather icon

0°

IQAir AirVisual Air Quality Map Wind rotating 25 degree

8

km/h

Humidity icon

99%

13:00

14

Weather icon

0°

IQAir AirVisual Air Quality Map Wind rotating 29 degree

7

km/h

Humidity icon

98%

14:00

14

Weather icon

0°

IQAir AirVisual Air Quality Map Wind rotating 24 degree

4

km/h

Humidity icon

95%

15:00

9

Weather icon

0°

IQAir AirVisual Air Quality Map Wind rotating 324 degree

2

km/h

Humidity icon

95%

16:00

9

Weather icon

0°

IQAir AirVisual Air Quality Map Wind rotating 17 degree

2

km/h

Humidity icon

94%

17:00

9

Weather icon

-1°

IQAir AirVisual Air Quality Map Wind rotating 187 degree

3

km/h

Humidity icon

96%

18:00

9

Weather icon

-3°

IQAir AirVisual Air Quality Map Wind rotating 201 degree

5

km/h

Humidity icon

97%

19:00

9

Weather icon

-4°

IQAir AirVisual Air Quality Map Wind rotating 225 degree

5

km/h

Humidity icon

97%

20:00

9

Weather icon

-5°

IQAir AirVisual Air Quality Map Wind rotating 247 degree

5

km/h

Humidity icon

97%

21:00

16

Weather icon

-6°

IQAir AirVisual Air Quality Map Wind rotating 268 degree

6

km/h

Humidity icon

96%

22:00

16

Weather icon

-6°

IQAir AirVisual Air Quality Map Wind rotating 261 degree

7

km/h

Humidity icon

95%

23:00

16

Weather icon

-7°

IQAir AirVisual Air Quality Map Wind rotating 270 degree

7

km/h

Humidity icon

95%

Thu

00:00

17

Weather icon

-7°

IQAir AirVisual Air Quality Map Wind rotating 268 degree

7

km/h

Humidity icon

94%

01:00

17

Weather icon

-8°

IQAir AirVisual Air Quality Map Wind rotating 264 degree

7

km/h

Humidity icon

93%

02:00

17

Weather icon

-8°

IQAir AirVisual Air Quality Map Wind rotating 272 degree

7

km/h

Humidity icon

92%

03:00

9

Weather icon

-8°

IQAir AirVisual Air Quality Map Wind rotating 265 degree

7

km/h

Humidity icon

92%

04:00

9

Weather icon

-8°

IQAir AirVisual Air Quality Map Wind rotating 262 degree

6

km/h

Humidity icon

91%

05:00

9

Weather icon

-8°

IQAir AirVisual Air Quality Map Wind rotating 265 degree

7

km/h

Humidity icon

91%

06:00

10

Weather icon

-8°

IQAir AirVisual Air Quality Map Wind rotating 254 degree

6

km/h

Humidity icon

91%

07:00

10

Weather icon

-7°

IQAir AirVisual Air Quality Map Wind rotating 260 degree

5

km/h

Humidity icon

91%

08:00

10

Weather icon

-7°

IQAir AirVisual Air Quality Map Wind rotating 248 degree

5

km/h

Humidity icon

91%

09:00

19

Weather icon

-7°

IQAir AirVisual Air Quality Map Wind rotating 242 degree

4

km/h

Humidity icon

91%

10:00

19

Weather icon

-5°

IQAir AirVisual Air Quality Map Wind rotating 219 degree

4

km/h

Humidity icon

89%

11:00

19

Weather icon

-4°

IQAir AirVisual Air Quality Map Wind rotating 187 degree

5

km/h

Humidity icon

86%

12:00

14

Weather icon

-2°

IQAir AirVisual Air Quality Map Wind rotating 177 degree

8

km/h

Humidity icon

86%

13:00

14

Weather icon

-2°

IQAir AirVisual Air Quality Map Wind rotating 145 degree

7

km/h

Humidity icon

86%

14:00

14

Weather icon

-1°

IQAir AirVisual Air Quality Map Wind rotating 155 degree

13

km/h

Humidity icon

87%

15:00

16

Weather icon

-1°

IQAir AirVisual Air Quality Map Wind rotating 148 degree

9

km/h

Humidity icon

88%

16:00

16

Weather icon

-2°

IQAir AirVisual Air Quality Map Wind rotating 140 degree

11

km/h

Humidity icon

93%

17:00

16

Weather icon

-3°

IQAir AirVisual Air Quality Map Wind rotating 144 degree

7

km/h

Humidity icon

96%

18:00

14

Weather icon

-5°

IQAir AirVisual Air Quality Map Wind rotating 142 degree

5

km/h

Humidity icon

97%

19:00

14

Weather icon

-5°

IQAir AirVisual Air Quality Map Wind rotating 152 degree

8

km/h

Humidity icon

98%

20:00

14

Weather icon

-6°

IQAir AirVisual Air Quality Map Wind rotating 154 degree

5

km/h

Humidity icon

98%

21:00

24

Weather icon

-6°

IQAir AirVisual Air Quality Map Wind rotating 162 degree

5

km/h

Humidity icon

98%

22:00

24

Weather icon

-5°

IQAir AirVisual Air Quality Map Wind rotating 160 degree

5

km/h

Humidity icon

98%

23:00

24

Weather icon

-5°

IQAir AirVisual Air Quality Map Wind rotating 151 degree

5

km/h

Humidity icon

98%

Fri

00:00

15

Weather icon

-5°

IQAir AirVisual Air Quality Map Wind rotating 178 degree

5

km/h

Humidity icon

98%

01:00

15

Weather icon

-5°

IQAir AirVisual Air Quality Map Wind rotating 195 degree

5

km/h

Humidity icon

97%

02:00

15

Weather icon

-4°

IQAir AirVisual Air Quality Map Wind rotating 216 degree

5

km/h

Humidity icon

97%

03:00

13

Weather icon

-4°

IQAir AirVisual Air Quality Map Wind rotating 231 degree

4

km/h

Humidity icon

96%

04:00

13

Weather icon

-4°

IQAir AirVisual Air Quality Map Wind rotating 244 degree

4

km/h

Humidity icon

95%

05:00

13

Weather icon

-5°

IQAir AirVisual Air Quality Map Wind rotating 274 degree

5

km/h

Humidity icon

94%

06:00

9

Weather icon

-5°

IQAir AirVisual Air Quality Map Wind rotating 307 degree

8

km/h

Humidity icon

93%

Daily forecast

|

Calgary air quality index (AQI⁺) forecast

Air pollutants

What is the current air quality in Calgary?

IQAir Check icon

PM2.5 concentration currently meets the WHO annual PM2.5 guideline.
Health recommendations

Clean Air Facilities

Pollen

What is the pollen count in Calgary today?

Index

Pollen global icon

None

Pollen tree icon

Tree

None

0%
Pollen grass icon

Grass

None

0%
Pollen weed icon

Weed

None

0%

Source:

wetter.com
Pollen forecast in Calgary

Health recommendations

Pollen

What is the pollen count in Calgary today?

Index

Pollen global icon

None

Pollen tree icon

Tree

None

0%
Pollen grass icon

Grass

None

0%
Pollen weed icon

Weed

None

0%

Source:

wetter.com
Pollen forecast in Calgary

Most polluted locations near Calgary

Worldwide AQI⁺ rankingArrow icon

Station ranking

Real-time AQI⁺ station ranking for stations in Calgary

#StationsAQI⁺ US
1
The national flag of Canada

5705 23 Ave SE

27

2
The national flag of Canada

1527 Lake Twintree Way SE

23

3
The national flag of Canada

26-54 Macewan Park View NW

23

4
The national flag of Canada

469-555 85 St SW

20

5
The national flag of Canada

250-196 Citadel Estates Heights NW

19

6
The national flag of Canada

3815 16 St SW

19

7
The national flag of Canada

72 Ave NE

18

8
The national flag of Canada

302 - 200 Patina Court SW

16

9
The national flag of Canada

100 Gordon Dr SW

13

10
The national flag of Canada

2144 Paliswood Rd

6

City ranking

Real-time Canada AQI⁺ city ranking

#CitiesAQI⁺ US
1
The national flag of Canada

Chase, British Columbia

165

2
The national flag of Canada

Windsor, Ontario

119

3
The national flag of Canada

Waterloo, Ontario

107

4
The national flag of Canada

East York, Ontario

99

5
The national flag of Canada

Brampton, Ontario

89

6
The national flag of Canada

Uxbridge, Ontario

82

7
The national flag of Canada

Port Stanley, Ontario

80

8
The national flag of Canada

Guelph, Ontario

79

9
The national flag of Canada

Owen Sound, Ontario

75

10
The national flag of Canada

Hamilton, Ontario

69

History

Historic air quality graph for Calgary

26 AQI⁺ US
Good
06:00–07:00 Nov 17 Local time
AQI⁺ US

History

Historic air quality graph for Calgary

26 AQI⁺ US
Good
06:00–07:00 Nov 17 Local time
AQI⁺ US

Clean Air Facilities

Most polluted locations near Calgary

Worldwide AQI⁺ rankingArrow icon

Station ranking

Real-time AQI⁺ station ranking for stations in Calgary

#StationsAQI⁺ US
1
The national flag of Canada

5705 23 Ave SE

27

2
The national flag of Canada

1527 Lake Twintree Way SE

23

3
The national flag of Canada

26-54 Macewan Park View NW

23

4
The national flag of Canada

469-555 85 St SW

20

5
The national flag of Canada

250-196 Citadel Estates Heights NW

19

6
The national flag of Canada

3815 16 St SW

19

7
The national flag of Canada

72 Ave NE

18

8
The national flag of Canada

302 - 200 Patina Court SW

16

9
The national flag of Canada

100 Gordon Dr SW

13

10
The national flag of Canada

2144 Paliswood Rd

6

City ranking

Real-time Canada AQI⁺ city ranking

#CitiesAQI⁺ US
1
The national flag of Canada

Chase, British Columbia

165

2
The national flag of Canada

Windsor, Ontario

119

3
The national flag of Canada

Waterloo, Ontario

107

4
The national flag of Canada

East York, Ontario

99

5
The national flag of Canada

Brampton, Ontario

89

6
The national flag of Canada

Uxbridge, Ontario

82

7
The national flag of Canada

Port Stanley, Ontario

80

8
The national flag of Canada

Guelph, Ontario

79

9
The national flag of Canada

Owen Sound, Ontario

75

10
The national flag of Canada

Hamilton, Ontario

69

Measure your own air quality

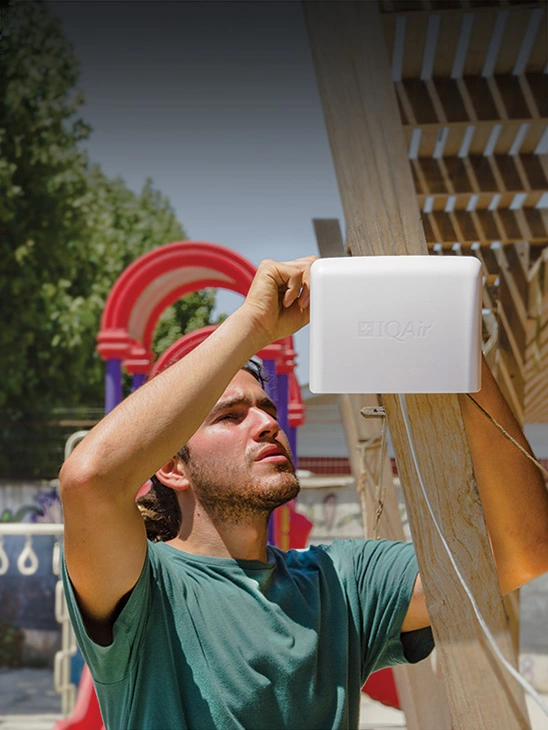
Get a monitor and contribute air quality data in your city.

What is the current air quality in Calgary?

The current air quality in Calgary is considered good. Air pollution levels are low and there are no expected health risks, making it a good time to enjoy normal outdoor activities.

Is Calgary a city with a good quality of air?

Calgary is a city located in the southern region of Canada, not far from the northern border of the United States, and is contained within the province of Alberta. It saw a huge amount of development due to being at the center of Canadas oil industry, and is now a well developed city with many skyscrapers and a good urban infrastructure. It has a population of approximately 1.58 million people, making it the most populous city in the province of Alberta, and second out of all cities in the western portion of Canada.

It has a strong economy centered around energy production industries, the finance sector, entertainment, technology and many more, being home to many corporate headquarters and head offices. Whilst these are all great factors for quality of life for its inhabitants, it can occasionally have an effect on the pollution levels, bringing the numbers to less than appreciable levels. Whilst overall it has a very good quality of air in regards to cities worldwide, there are certain months when the pollution levels rise.

In 2019, Calgary came in at 3828th place out of all cities ranked worldwide, with a PM2.5 reading of 6.9 μg/m³, one that placed it into the World Health Organizations (WHO's) target rating for the best quality of air at 10 μg/m³ or less, with the closer to 0 a city achieves of course being the most optimal. This very respectable reading of 6.9 μg/m³ also placed it in 71st place out of all cities ranked in Canada, showing how good the countries overall air quality is, which in itself ranks 90th out of all 98 countries registered worldwide, being one of the countries that sees some of the cleaner air qualities round the globe.

What are some of the main causes of air pollution in Calgary?

Whilst much of the year sees a great level of air quality, there are times when these PM2.5 readings rise considerably, which will be discussed in more detail in following. PM2.5 refers to particulate matter that is 2.5 micrometers or less in diameter, on occasion going down to sizes as small as 0.001 microns across. Due to this extremely small size, it has the potential to cause significant damage to human health, and as such is used as a major component in the calculation of the overall AQI, or air quality index.

Some of the main causes of pollution in Calgary would be emissions from vehicles, ranging from personal ones such as motorbikes and cars, up to industrial or service ones such as trucks, lorries and buses, with these larger ones often releasing higher amounts of fumes and thus being a significant contributor to pollution levels, as well as releasing microscopic traces of rubber on the roads in large quantities. Other causes include ones such as industrial emissions, coming from factories and power plants, as well as the agricultural sector. Construction sites can release numerous contaminating chemicals and fine particulate matter into the air, and lastly, the burning of wood by individual citizens can also skew the air quality readings, leading to higher numbers being shown.

What are some of the main pollutants found in the air in Calgary?

Due to a large amount of sectors and industries contributing to pollution levels in Calgary, there would be a wide variety of chemical contaminants and fine particulate matter permeating the ground level air and upper atmosphere in Calgary. Some of these would be ones that see their release from vehicles, which include black carbon, the main component of soot and a potent carcinogen when inhaled. It also has prominent effects on the environment due to its property of absorbing solar radiation and releasing it as heat, having climate altering effects if left to gather in large enough quantities. Other chemicals released from vehicles include nitrogen dioxide (NO2) and sulfur dioxide (SO2), with nitrogen dioxide always being the most prominent offender when it comes to pollution found over areas of high traffic.

Other noteworthy pollutants in the air would be volatile organic compounds (VOC's) such as benzene, methylene chloride and formaldehyde, of great danger to human health due to their ability to maintain a gaseous state at much colder temperatures, and thus much easier to respire. In closing, others found in the air would be microscopic particles of rubber and plastic, as well as finely ground silica and concrete dust released from construction sites, alongside dioxins, furans and even the occasional toxic metal such as lead or mercury.

When is the air quality at its best in Calgary?

Going off the data gathered over the course of 2019, Calgary saw its best levels of air quality in the months of June through to November, and whilst the whole year itself came in with respectable readings within the WHO's target goal (aside from one month that came in significantly higher, which was May with a reading of 14.4 μg/m³), there were periods where the PM2.5 levels dropped even lower, albeit without as strong a pattern as some other cities that see distinct summer and winter seasons occurring.

The cleanest months of the year were April (somewhat anomalous due to being sandwiched between two much more polluted months), June, September and November, all with PM2.5 readings of 4.9 μg/m³, 4.9 μg/m³, 4.4 μg/m³ and 4.9 μg/m³ respectively, with the number 4.9 μg/m³ making multiple appearances. This indicates that September was the cleanest month of the entire year during 2019 with its reading of 4.4 μg/m³.

Is the air quality improving in Calgary?

Looking at the data taken in the years prior to 2019, we can observe that there was a difference in the yearly averages available. 2017 came in with a PM2.5 average of 7.5 μg/m³, a respectable reading by any means that was still within the WHO's target goal. This was followed in 2018 with a yearly average of 10.9 μg/m³, one that represented a significant jump that was enough to earn itself a place in the ‘good’ ratings bracket, which requires a PM2.5 reading of anywhere between 10 to 12 μg/m³ for classification. So, in hindsight, with 2019’s reading of 6.9 μg/m³ being available, it is clear that the air quality has improved over the last two years, a great indicator that any initiatives in place to clean up the air are indeed working, and may see further improvements over the following years.