WorldArrow icon
Arrow iconAmravati

Air quality in Amravati

Air quality index (AQI⁺) and PM2.5 air pollution in Amravati • 877 Followers • 08:30, Oct 22 Local time

98*

US AQI⁺

Moderate

face expression based on aqi value

Main pollutant:

PM2.5

34.6 µg/m³

weather condition icon

31°

wind direction icon

13 km/h

weather humid icon

63 %

Hourly forecast

Amravati air quality index (AQI⁺) forecast

Now

98

Weather icon

31°

IQAir AirVisual Air Quality Map Wind rotating 49 degree

13

km/h

Humidity icon

63%

11:30

95

Weather icon

32°

IQAir AirVisual Air Quality Map Wind rotating 56 degree

13

km/h

Humidity icon

61%

12:30

95

Weather icon

80%

32°

IQAir AirVisual Air Quality Map Wind rotating 56 degree

11

km/h

Humidity icon

59%

13:30

95

Weather icon

80%

32°

IQAir AirVisual Air Quality Map Wind rotating 56 degree

10

km/h

Humidity icon

60%

14:30

96

Weather icon

32°

IQAir AirVisual Air Quality Map Wind rotating 59 degree

11

km/h

Humidity icon

61%

15:30

92

Weather icon

31°

IQAir AirVisual Air Quality Map Wind rotating 83 degree

8

km/h

Humidity icon

71%

16:30

87

Weather icon

28°

IQAir AirVisual Air Quality Map Wind rotating 124 degree

11

km/h

Humidity icon

81%

17:30

82

Weather icon

27°

IQAir AirVisual Air Quality Map Wind rotating 126 degree

10

km/h

Humidity icon

88%

18:30

81

Weather icon

26°

IQAir AirVisual Air Quality Map Wind rotating 98 degree

8

km/h

Humidity icon

87%

19:30

79

Weather icon

26°

IQAir AirVisual Air Quality Map Wind rotating 98 degree

10

km/h

Humidity icon

87%

20:30

78

Weather icon

26°

IQAir AirVisual Air Quality Map Wind rotating 100 degree

9

km/h

Humidity icon

88%

21:30

82

Weather icon

26°

IQAir AirVisual Air Quality Map Wind rotating 94 degree

9

km/h

Humidity icon

88%

22:30

86

Weather icon

25°

IQAir AirVisual Air Quality Map Wind rotating 87 degree

8

km/h

Humidity icon

88%

23:30

91

Weather icon

25°

IQAir AirVisual Air Quality Map Wind rotating 80 degree

7

km/h

Humidity icon

89%

Fri

00:30

90

Weather icon

25°

IQAir AirVisual Air Quality Map Wind rotating 67 degree

6

km/h

Humidity icon

90%

01:30

89

Weather icon

25°

IQAir AirVisual Air Quality Map Wind rotating 50 degree

5

km/h

Humidity icon

91%

02:30

88

Weather icon

70%

24°

IQAir AirVisual Air Quality Map Wind rotating 38 degree

5

km/h

Humidity icon

93%

03:30

91

Weather icon

24°

IQAir AirVisual Air Quality Map Wind rotating 46 degree

5

km/h

Humidity icon

93%

04:30

94

Weather icon

24°

IQAir AirVisual Air Quality Map Wind rotating 13 degree

5

km/h

Humidity icon

93%

05:30

97

Weather icon

24°

IQAir AirVisual Air Quality Map Wind rotating 340 degree

6

km/h

Humidity icon

93%

06:30

100

Weather icon

25°

IQAir AirVisual Air Quality Map Wind rotating 338 degree

6

km/h

Humidity icon

93%

07:30

103

Weather icon

26°

IQAir AirVisual Air Quality Map Wind rotating 10 degree

5

km/h

Humidity icon

88%

08:30

107

Weather icon

28°

IQAir AirVisual Air Quality Map Wind rotating 38 degree

7

km/h

Humidity icon

80%

09:30

110

Weather icon

29°

IQAir AirVisual Air Quality Map Wind rotating 58 degree

9

km/h

Humidity icon

72%

10:30

113

Weather icon

30°

IQAir AirVisual Air Quality Map Wind rotating 72 degree

10

km/h

Humidity icon

66%

11:30

117

Weather icon

31°

IQAir AirVisual Air Quality Map Wind rotating 65 degree

9

km/h

Humidity icon

63%

12:30

126

Weather icon

70%

32°

IQAir AirVisual Air Quality Map Wind rotating 49 degree

9

km/h

Humidity icon

59%

13:30

135

Weather icon

33°

IQAir AirVisual Air Quality Map Wind rotating 69 degree

7

km/h

Humidity icon

55%

14:30

145

Weather icon

31°

IQAir AirVisual Air Quality Map Wind rotating 129 degree

9

km/h

Humidity icon

67%

15:30

148

Weather icon

70%

30°

IQAir AirVisual Air Quality Map Wind rotating 149 degree

12

km/h

Humidity icon

81%

16:30

152

Weather icon

29°

IQAir AirVisual Air Quality Map Wind rotating 161 degree

9

km/h

Humidity icon

85%

17:30

156

Weather icon

28°

IQAir AirVisual Air Quality Map Wind rotating 175 degree

6

km/h

Humidity icon

84%

18:30

154

Weather icon

27°

IQAir AirVisual Air Quality Map Wind rotating 170 degree

5

km/h

Humidity icon

84%

19:30

152

Weather icon

27°

IQAir AirVisual Air Quality Map Wind rotating 152 degree

6

km/h

Humidity icon

84%

20:30

151

Weather icon

26°

IQAir AirVisual Air Quality Map Wind rotating 151 degree

7

km/h

Humidity icon

86%

21:30

145

Weather icon

25°

IQAir AirVisual Air Quality Map Wind rotating 165 degree

5

km/h

Humidity icon

88%

22:30

140

Weather icon

25°

IQAir AirVisual Air Quality Map Wind rotating 182 degree

5

km/h

Humidity icon

90%

23:30

135

Weather icon

25°

IQAir AirVisual Air Quality Map Wind rotating 182 degree

4

km/h

Humidity icon

91%

Sat

00:30

134

Weather icon

24°

IQAir AirVisual Air Quality Map Wind rotating 162 degree

3

km/h

Humidity icon

92%

01:30

134

Weather icon

24°

IQAir AirVisual Air Quality Map Wind rotating 130 degree

1

km/h

Humidity icon

92%

02:30

134

Weather icon

24°

IQAir AirVisual Air Quality Map Wind rotating 310 degree

3

km/h

Humidity icon

93%

03:30

119

Weather icon

24°

IQAir AirVisual Air Quality Map Wind rotating 320 degree

4

km/h

Humidity icon

93%

04:30

104

Weather icon

24°

IQAir AirVisual Air Quality Map Wind rotating 333 degree

2

km/h

Humidity icon

93%

05:30

90

Weather icon

24°

IQAir AirVisual Air Quality Map Wind rotating 8 degree

3

km/h

Humidity icon

93%

06:30

87

Weather icon

24°

IQAir AirVisual Air Quality Map Wind rotating 343 degree

5

km/h

Humidity icon

92%

07:30

84

Weather icon

26°

IQAir AirVisual Air Quality Map Wind rotating 333 degree

4

km/h

Humidity icon

86%

08:30

81

Weather icon

28°

IQAir AirVisual Air Quality Map Wind rotating 326 degree

6

km/h

Humidity icon

79%

09:30

81

Weather icon

29°

IQAir AirVisual Air Quality Map Wind rotating 341 degree

5

km/h

Humidity icon

70%

10:30

81

Weather icon

31°

IQAir AirVisual Air Quality Map Wind rotating 335 degree

5

km/h

Humidity icon

61%

11:30

81

Weather icon

32°

IQAir AirVisual Air Quality Map Wind rotating 342 degree

4

km/h

Humidity icon

55%

12:30

80

Weather icon

33°

IQAir AirVisual Air Quality Map Wind rotating 340 degree

4

km/h

Humidity icon

52%

13:30

79

Weather icon

33°

IQAir AirVisual Air Quality Map Wind rotating 353 degree

2

km/h

Humidity icon

49%

14:30

78

Weather icon

33°

IQAir AirVisual Air Quality Map Wind rotating 11 degree

4

km/h

Humidity icon

48%

15:30

75

Weather icon

33°

IQAir AirVisual Air Quality Map Wind rotating 27 degree

5

km/h

Humidity icon

48%

16:30

72

Weather icon

32°

IQAir AirVisual Air Quality Map Wind rotating 63 degree

6

km/h

Humidity icon

57%

17:30

70

Weather icon

28°

IQAir AirVisual Air Quality Map Wind rotating 134 degree

7

km/h

Humidity icon

72%

18:30

70

Weather icon

27°

IQAir AirVisual Air Quality Map Wind rotating 162 degree

9

km/h

Humidity icon

81%

19:30

70

Weather icon

26°

IQAir AirVisual Air Quality Map Wind rotating 156 degree

7

km/h

Humidity icon

86%

20:30

70

Weather icon

25°

IQAir AirVisual Air Quality Map Wind rotating 211 degree

3

km/h

Humidity icon

88%

21:30

74

Weather icon

25°

IQAir AirVisual Air Quality Map Wind rotating 241 degree

6

km/h

Humidity icon

87%

22:30

78

Weather icon

24°

IQAir AirVisual Air Quality Map Wind rotating 248 degree

5

km/h

Humidity icon

87%

23:30

82

Weather icon

24°

IQAir AirVisual Air Quality Map Wind rotating 256 degree

4

km/h

Humidity icon

88%

Sun

00:30

83

Weather icon

24°

IQAir AirVisual Air Quality Map Wind rotating 292 degree

4

km/h

Humidity icon

88%

01:30

85

Weather icon

23°

IQAir AirVisual Air Quality Map Wind rotating 319 degree

3

km/h

Humidity icon

88%

02:30

87

Weather icon

23°

IQAir AirVisual Air Quality Map Wind rotating 282 degree

2

km/h

Humidity icon

88%

03:30

90

Weather icon

23°

IQAir AirVisual Air Quality Map Wind rotating 295 degree

6

km/h

Humidity icon

86%

04:30

93

Weather icon

23°

IQAir AirVisual Air Quality Map Wind rotating 305 degree

7

km/h

Humidity icon

83%

05:30

96

Weather icon

22°

IQAir AirVisual Air Quality Map Wind rotating 318 degree

6

km/h

Humidity icon

78%

06:30

90

Weather icon

22°

IQAir AirVisual Air Quality Map Wind rotating 307 degree

7

km/h

Humidity icon

74%

07:30

85

Weather icon

24°

IQAir AirVisual Air Quality Map Wind rotating 310 degree

8

km/h

Humidity icon

68%

08:30

80

Weather icon

26°

IQAir AirVisual Air Quality Map Wind rotating 318 degree

11

km/h

Humidity icon

61%

09:30

84

Weather icon

28°

IQAir AirVisual Air Quality Map Wind rotating 333 degree

11

km/h

Humidity icon

57%

Daily forecast

|

Amravati air quality index (AQI⁺) forecast

Air pollutants

What is the current air quality in Amravati?

IQAir exclamation icon

PM2.5 concentration is currently 6.9 times the World Health Organization annual PM2.5 guideline value.
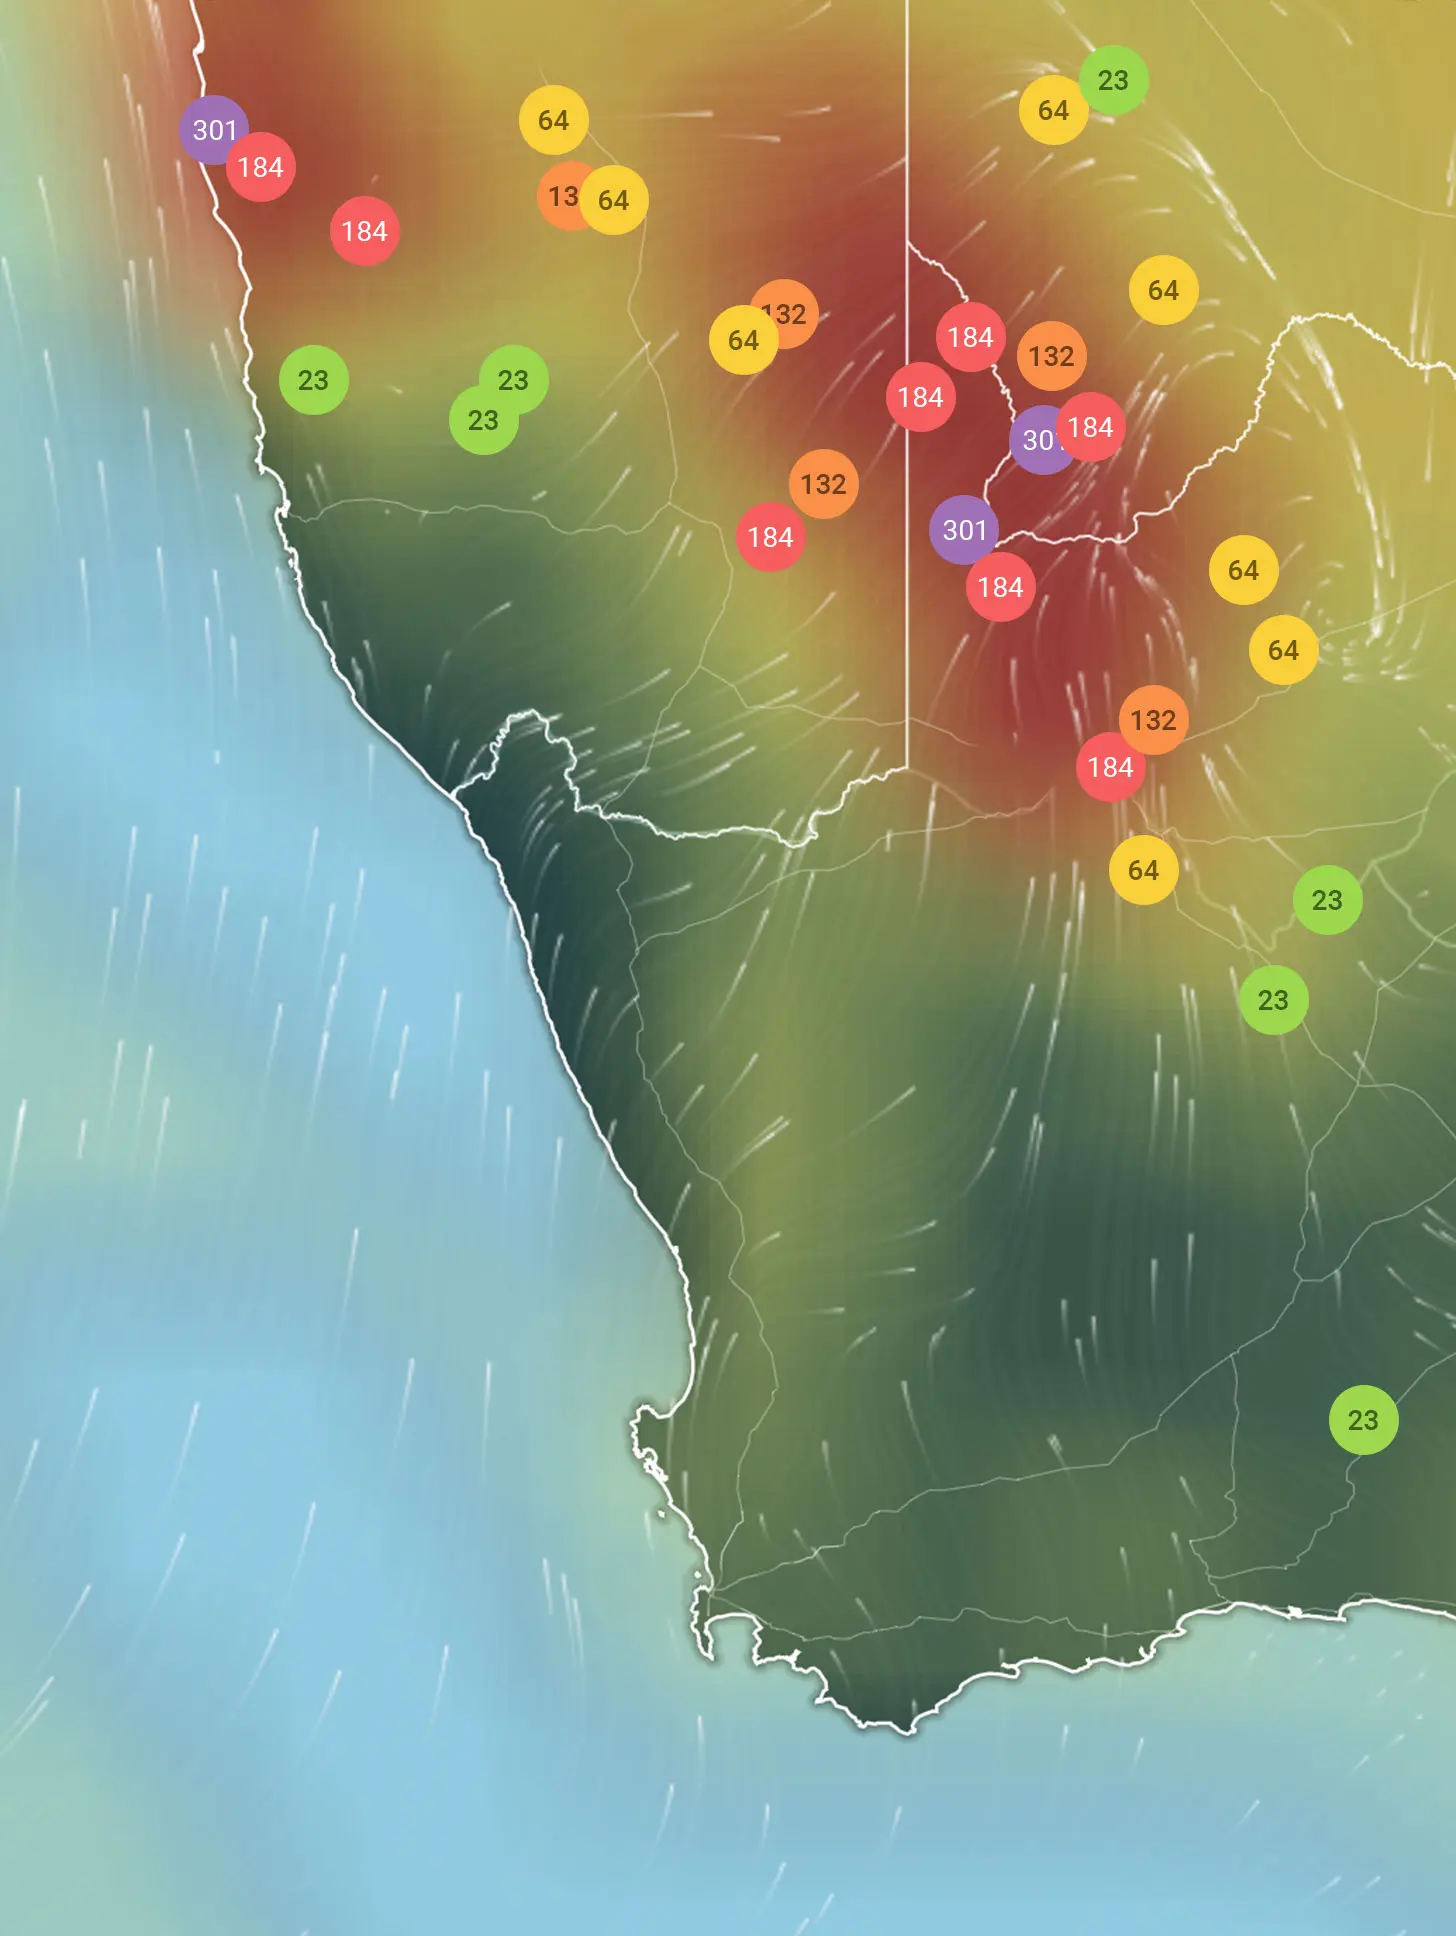
Health recommendations

Health recommendations

Most polluted locations near Amravati

Worldwide AQI⁺ rankingArrow icon

City ranking

Real-time India AQI⁺ city ranking

#CitiesAQI⁺ US
1
The national flag of India

Delhi, Delhi

223

2
The national flag of India

Gurugram, Haryana

214

3
The national flag of India

Srinagar, Jammu and Kashmir

211

4
The national flag of India

New Delhi, Delhi

198

5
The national flag of India

Haldia, West Bengal

170

6
The national flag of India

Kultali, West Bengal

169

7
The national flag of India

Sodpur, West Bengal

167

8
The national flag of India

Titagarh, West Bengal

164

9
The national flag of India

Mumbai, Maharashtra

161

10
The national flag of India

Raniganj, West Bengal

160

History

Historic air quality graph for Amravati

98 AQI⁺ US
Moderate
08:30–09:30 Oct 22 Local time
AQI⁺ US

History

Historic air quality graph for Amravati

98 AQI⁺ US
Moderate
08:30–09:30 Oct 22 Local time
AQI⁺ US

Most polluted locations near Amravati

Worldwide AQI⁺ rankingArrow icon

City ranking

Real-time India AQI⁺ city ranking

#CitiesAQI⁺ US
1
The national flag of India

Delhi, Delhi

223

2
The national flag of India

Gurugram, Haryana

214

3
The national flag of India

Srinagar, Jammu and Kashmir

211

4
The national flag of India

New Delhi, Delhi

198

5
The national flag of India

Haldia, West Bengal

170

6
The national flag of India

Kultali, West Bengal

169

7
The national flag of India

Sodpur, West Bengal

167

8
The national flag of India

Titagarh, West Bengal

164

9
The national flag of India

Mumbai, Maharashtra

161

10
The national flag of India

Raniganj, West Bengal

160

Be the first to measure and contribute air quality data to your community

What is the current air quality in Amravati?

The current air quality in Amravati is considered moderate. Air quality is acceptable for most people, though sensitive individuals may experience mild symptoms such as coughing or shortness of breath.

Are there high pollution levels present in Amaravati?

Amaravati is an Indian city located in the state of Andhra Pradesh, being counted as the legislative capital as well as the seat of governance. Andhra Pradesh itself sits in the south-eastern coastal region of India, with Amaravati being adjacent to the Krishna River, one of the largest rivers in India after other great ones such as the Ganges, Brahmaputra and the Godavari. Looking at the levels of air quality present in 2020 as well as years prior, it can be seen that Amaravati is subject to some less than perfect pollution levels.

Whilst it does not rank as highly as some of the other cities in India, it still manages to come in within the top 500 most polluted cities worldwide, as of 2020, with PM2.5 readings that indicated a poor level of air quality, with certain months having readings that went up to dangerous heights, bringing with them numerous health issues. These issues would become more apparent in certain members of the population, with these at-risk groups being highly susceptible to the respiratory and cardiac effects that high pollution can bring.

Observing the air quality collected in late May of 2021, it can be seen that Amaravati came in with a US AQI reading of 67. This placed it into the ‘moderate’ air pollution ratings bracket, which is color coded as yellow, and requires a reading of anywhere between 51 to 100 to be classified as moderately polluted. According to the guidelines set out by the US Environmental Protection Agency (EPA), any reading between 0 to 150 is classified as being within the acceptable range, containing within it three different ratings brackets (‘good’, ‘moderate’ and ‘unhealthy for sensitive groups’ at the higher end).

The reading of 67 that was taken in Amaravati may present some health issues for those vulnerable groups, but the general public as a whole may remain unaffected. These US AQI readings are aggregated from the main different pollutants found in the air, namely ones such as ozone (O3), nitrogen dioxide (NO2), sulfur dioxide (SO2) as well as the two main particulate matters, PM2.5 and PM10.

PM2.5 is by far the more dangerous of the two, and is actually considered as one of the most harmful forms of pollution, both in Amaravati and worldwide. As a result, PM2.5 can be used as a prominent measure in its own right, often used to calculate yearly averages of pollution, as well as the months of the year. Of note is that it uses the same ratings system as the US AQI one, albeit with different units required per rating, with measures of PM2.5 being taken in micrograms per cubic meter (μg/m³).

Looking at other readings of US AQI that were taken over the course of May in 2021, it can be seen that Amaravati was fortunate enough to have many days come in with clean levels of air quality, with readings going as low as 12 and 14, indicating a ‘good’ level of air quality. However, highs of 102 and 141 were also taken, showing that the city is subject to days that have large elevations in their pollution level, thus making the air quality somewhat hazardous for vulnerable individuals. The use of preventative measures such as wearing fine particle filtering masks and avoiding outdoor activity may become ever more pertinent during these periods of high pollution.

What causes such high pollution readings in Amaravati?

The main causes of air pollution in Amaravati are ones such as emissions from cars, motorbikes, tuk tuk’s and heavier freight vehicles such as trucks and lorries. With an increase in industry and economy often comes a boom in car use, leading to large amounts of pollution being released into the air as a result.

Vehicles are considered as one of the leading sources of pollution throughout the state of Andhra Pradesh, and this remains true for the city of Amaravati. Many of these vehicles would be running on lower quality fuel, as well as the vehicle models themselves being extremely aged and worn down, leading to a larger amount of oil vapors and noxious chemical compounds and particles being released as a result.

Other major sources of pollution include construction sites, which can release all manner of fine particles, as well as heavy metals such as mercury and lead. Emissions from factories and power plants also remains one of the more prominent offenders alongside vehicle fumes, along with the open burning of refuse and waste.

Is it dangerous to breathe large amounts of polluted air in Amaravati?

Some health effects that come along with breathing the air in Amaravati during periods of high pollution include ones such as chronic obstructive pulmonary disease (COPD), an umbrella term that includes within it many different respiratory ailments such as pneumonia, bronchitis, emphysema and asthma.

Other issues include irritation and aggravation to the skin and exposed mucous membranes, along with inflammation to the respiratory tract and the lining of the lungs. Respiratory infections can increase, along with more serious conditions such as heart attacks, cancer of the lungs and skin, ischemic heart disease, and death.

When does Amaravati experience its worst air pollution levels?

With the information from 2020 being used as a measure of air pollution levels in Amaravati, it can be seen that the months of January and December were the most polluted, coming in with readings of 40.1 μg/m³ and 70.4 μg/m³.

This placed January in the ‘unhealthy for sensitive groups’ bracket, as well as placing December into the ‘unhealthy’ ratings bracket, with its reading of 70.4 μg/m³ making it the most polluted month of the year by a significant amount, and the only month in 2020 to achieve the unhealthy status.

Has the air quality seen any improvements in Amaravati?

With the air quality from past years on hand, it can be seen that pollution levels have followed a good trend of improving from 2018 to 2020. The PM2.5 reading in 2018 was 35.6 μg/m³ as its yearly bracket, followed by an improved reading of 33 μg/m³ in 2019, and then a further reading of 28.9 μg/m³ in 2020.

This reading place Amaravati in 98th place out of all cities ranked in India, as well as in 421st place out of all cities ranked worldwide. Whilst it still has a way to go to see safer air quality, it has shown a marked improvement, indicating that it is moving in the right direction.

Where is the cleanest air quality in Amravati?

No locations are available.