Add
Air quality in Powai
Air quality index (AQI⁺) and PM2.5 air pollution in Powai • 16.3K Followers • 17:30, Nov 15 Local time

128*
US AQI⁺Unhealthy for sensitive groups

Main pollutant:
PM2.5
46.4 µg/m³

29°

20 km/h

38 %
Hourly forecast
Powai air quality index (AQI⁺) forecast


Daily forecast
Powai air quality index (AQI⁺) forecast
| Today | 130 |  | 32° 25° |  20 km/h | 36% |
| Mon | 128 |  | 31° 24° | 21 km/h | 40% |
| Tue | 119 | | 32° 25° | 23 km/h | 40% |
Air pollutants
What is the current air quality in Powai?

PM2.5 concentration is currently 9.3 times the World Health Organization annual PM2.5 guideline value.
Health recommendations
 Reduce outdoor exercise |
 Close your windows to avoid dirty outdoor air Get a monitor |
 Sensitive groups should wear a mask outdoors Get a mask |
 Run an air purifier Get an air purifier |
Health recommendations
Reduce outdoor exercise |
Close your windows to avoid dirty outdoor air Get a monitor |
Sensitive groups should wear a mask outdoors Get a mask |
Run an air purifier Get an air purifier |
Most polluted locations near Powai
Worldwide AQI⁺ ranking

Historic air quality near Powai
History
Historic air quality graph for Powai
Historic air quality near Powai
History
Historic air quality graph for Powai
Most polluted locations near Powai
Worldwide AQI⁺ ranking


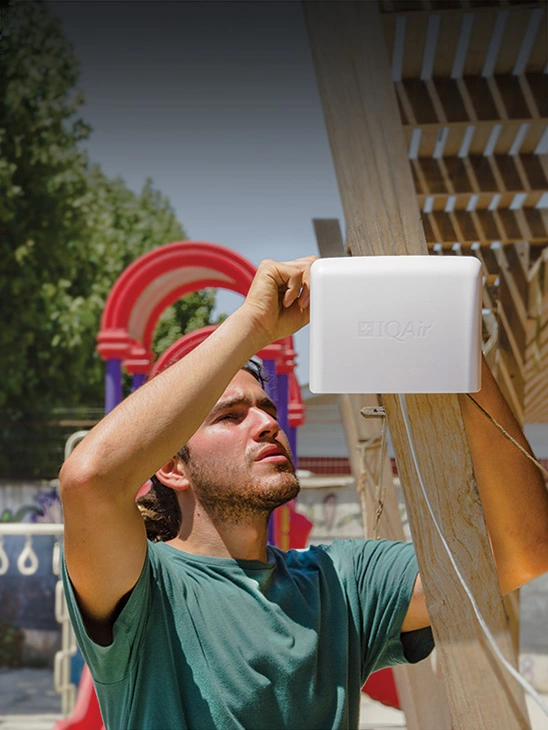
Be the first to measure and contribute air quality data to your community


Learn more about air pollution in Powai
What is the current air quality in Powai?
The current air quality in Powai is considered unhealthy for sensitive groups. Children, older adults, and people with heart or lung conditions may experience health effects, while the general public is less likely to be affected.
Is the air in Powai badly polluted?
Powai, located within the state of Maharashtra in the western and central regions of India, has seen some high levels of air pollution in the last few months, with one particularly bad spike of US AQI (a figure formed from the volume of the several main pollutants found in the air, which will be discussed in one of the following questions) being present in late January of 2022. As far as the air pollution level goes, it is not overtly dangerous and outright hazardous when compared to some of the more polluted cities throughout India. However, the US AQI and PM2.5 readings that consistently come in are most definitely not without consequence, for those that are forced to breathe this air daily, year in and year out. In late January, a US AQI spike of 271 was recorded, placing Powai into the ‘very unhealthy’ air quality rating bracket, color-coded as purple and being the second to worst out of all the air quality rankings (with the maroon colored ‘hazardous’ rating being the worst and most detrimental to people’s health as well as the environment, often as a result of intense industrial pollution combined with fires, anthropogenic movement and activity, as well as dust and other fine particle accumulation within a confined area). In the early days of February 2022, as a further example, a US AQI reading of 182 was recorded, placing Powai into the 'unhealthy' rating bracket, with its color-coding of red. These can be of aid when referring to the various air quality maps, graphs and forecasts on this page and throughout the website to get a quick overview of how good, or bad the air quality will be at a particular time. When this US AQI reading of 182 was taken, the PM2.5 (ultrafine particles that are 2.5 micrometers or less in diameter, being the most dangerous forms of air pollution due to their microscopic size) concentration was found to be 23 times over the World Health Organization's (WHO's) safe annual exposure guidelines. As such, the air in Powai is quite polluted, and although there will be many days throughout the year when pollution levels drop to less dangerous readings, it would be wise to still practice preventative measures such as wearing fine particle filtering masks, avoiding outdoor strenuous activities such as jogging, when pollution levels are high, as well as keeping doors and windows closed to prevent household pollution levels from rising too significantly. Air purifiers can also be run if they are available, which can aid greatly in keeping the air within houses or offices significantly cleaner than outside.
What are the dangers of breathing polluted air in Powai?
Continuous exposure to higher concentrations of pollution in the air in Powai can cause many dangerous or adverse health conditions to occur, being of particular prominence to certain individuals who are part of the sensitive group demographic, also covered later in the article. Despite certain groups being more at risk, it is well-known that even healthy or physically fit adults may find themselves on the receiving end of the negative side-effects caused by polluted air in Powai, particularly if this exposure is of a higher magnitude or takes place over a longer period, a factor that may be very important to note for those that find themselves living near to much more highly polluted areas such as industrial districts or near busy roads, whereby the air quality will be poorer, and hazardous particles more prevalent in the atmosphere for much of the year. A larger number of ailments can present themselves amongst inhabitants, as a result, would more common short-term conditions such as dry or sore throat with accompanying cough, as well as chest pain and mild infections of the respiratory tract. These can usually get better on their own accord once pollution exposure is halted or lessened. These count as some of the less serious but more common health issues within Powai. With continuous air pollution exposure taking place, respiratory aggravation may also develop into more long-term, chronic health problems. The continuous chest infections sustained as well as the accompanying coughing can lead to the scarring of lung tissue, which can result in a significantly (and often permanent) decreased lung capacity. Furthermore, the scarring and damage sustained to the tissue of the lungs can cause one to become more vulnerable to a whole host of respiratory ailments, with chronic obstructive pulmonary disease (COPD) typically showing itself in one form or another. A few examples of the different forms of COPD, which usually cause reduced lung capacity, shortness of breath and greater susceptibility to further respiratory complications. Some examples of illnesses that fall under the COPD bracket are pneumonia, bronchitis, emphysema and asthma. Other forms of damage that can happen within the body include increased risk of cancer, heart attacks, strokes and arrhythmias, as well as ischemic heart disease and many other cardiac or pulmonary conditions that can bring about decreased quality of life as well as lower life expectancy in Powai.
What are some of the main air pollutants found in Powai?
Some of the main air pollutants found in Powai would be those that make up the US AQI figure, which are the two forms of particle pollution, PM10 and PM2.5, along with nitrogen dioxide, sulfur dioxide, ozone (or smog as it is more commonly known as when it forms on the ground level. In the upper atmosphere it is a very important component but on ground level it becomes a highly dangerous pollutant to breathe), and carbon monoxide. Other pollutants include black carbon and Volatile organic compounds (VOCs), with some examples of VOCs including benzene, toluene, xylene, methylene chloride as well as formaldehyde.
Does air pollution exposure present more risk for certain people living in Powai?
There are indeed groups of people that are more severely affected by air pollution exposure in Powai. Those who are more likely to suffer from adverse effects from air pollutants exposure in Powai include the elderly, along with young children, pregnant mothers, as well as those that have pre-existing health conditions or compromised immune systems. Extra care and effort can be taken by these groups to ensure that chronic, acute or severe problems are avoided.
What are the main causes of air pollution within Powai?
Pollution levels in Powai can show prominent spikes due to a variety of different sources all contributing to these heightened numbers. Many of them release unique pollutants contained within smoke, haze and clouds of hazardous fine particulate matter. Along with certain ones that are unique to industrial processes or other polluting causes, there are also ones that are broader and tend to be released from many if not all of the polluting sources. The chemicals released from these sources will be discussed further in the article. Powai can see pollution coming from industrial areas in the nearby vicinity, along with factories, and other businesses (both large and small scale) that have a form of combustion taking place releasing pollutants. Any form of combustion can discharge extensive amounts of pollution into the air, and if these procedures are not regulated with strict protocol (which is more common in certain areas that have fewer rigid criteria in place), considerably larger amounts of dangerous pollution can escape into the air and drive the PM2.5 levels as well as the US AQI readings up. Powai can be subject to excessive amounts of pollution coming from sources such as the burning of fossil fuels like coal, oil, natural gas and diesel, all of which can be major contributing factors to the heightened pollution readings seen on recent records. Furthermore, vehicle ownership continues to grow annually in Powai, along with the rest of the state. Cars, motorbikes and further smaller personal vehicles discharge considerable amounts of pollution into the air, more so if they are of the aged or poorly maintained variety, or if lower-grade fuels are used in their engines.