WorldArrow icon
Arrow iconPali

Air quality in Pali

Air quality index (AQI⁺) and PM2.5 air pollution in Pali • 2.7K Followers • 11:30, Oct 22 Local time

93*

US AQI⁺

Moderate

face expression based on aqi value

Main pollutant:

PM2.5

31.5 µg/m³

weather condition icon

35°

wind direction icon

5 km/h

weather humid icon

18 %

Hourly forecast

Pali air quality index (AQI⁺) forecast

Now

93

Weather icon

35°

IQAir AirVisual Air Quality Map Wind rotating 81 degree

5

km/h

Humidity icon

18%

12:30

93

Weather icon

36°

IQAir AirVisual Air Quality Map Wind rotating 45 degree

7

km/h

Humidity icon

15%

13:30

92

Weather icon

36°

IQAir AirVisual Air Quality Map Wind rotating 25 degree

9

km/h

Humidity icon

14%

14:30

92

Weather icon

36°

IQAir AirVisual Air Quality Map Wind rotating 11 degree

10

km/h

Humidity icon

13%

15:30

89

Weather icon

36°

IQAir AirVisual Air Quality Map Wind rotating 1 degree

11

km/h

Humidity icon

13%

16:30

86

Weather icon

36°

IQAir AirVisual Air Quality Map Wind rotating 355 degree

12

km/h

Humidity icon

13%

17:30

83

Weather icon

34°

IQAir AirVisual Air Quality Map Wind rotating 352 degree

12

km/h

Humidity icon

15%

18:30

80

Weather icon

31°

IQAir AirVisual Air Quality Map Wind rotating 11 degree

12

km/h

Humidity icon

17%

19:30

78

Weather icon

30°

IQAir AirVisual Air Quality Map Wind rotating 60 degree

12

km/h

Humidity icon

19%

20:30

75

Weather icon

29°

IQAir AirVisual Air Quality Map Wind rotating 104 degree

14

km/h

Humidity icon

21%

21:30

71

Weather icon

29°

IQAir AirVisual Air Quality Map Wind rotating 138 degree

15

km/h

Humidity icon

23%

22:30

67

Weather icon

28°

IQAir AirVisual Air Quality Map Wind rotating 152 degree

15

km/h

Humidity icon

26%

23:30

64

Weather icon

27°

IQAir AirVisual Air Quality Map Wind rotating 154 degree

14

km/h

Humidity icon

25%

Fri

00:30

70

Weather icon

26°

IQAir AirVisual Air Quality Map Wind rotating 144 degree

11

km/h

Humidity icon

25%

01:30

76

Weather icon

25°

IQAir AirVisual Air Quality Map Wind rotating 123 degree

7

km/h

Humidity icon

26%

02:30

82

Weather icon

24°

IQAir AirVisual Air Quality Map Wind rotating 93 degree

5

km/h

Humidity icon

27%

03:30

80

Weather icon

24°

IQAir AirVisual Air Quality Map Wind rotating 116 degree

6

km/h

Humidity icon

27%

04:30

78

Weather icon

25°

IQAir AirVisual Air Quality Map Wind rotating 182 degree

8

km/h

Humidity icon

27%

05:30

77

Weather icon

25°

IQAir AirVisual Air Quality Map Wind rotating 166 degree

11

km/h

Humidity icon

30%

06:30

75

Weather icon

24°

IQAir AirVisual Air Quality Map Wind rotating 177 degree

13

km/h

Humidity icon

34%

07:30

74

Weather icon

25°

IQAir AirVisual Air Quality Map Wind rotating 183 degree

14

km/h

Humidity icon

36%

08:30

73

Weather icon

28°

IQAir AirVisual Air Quality Map Wind rotating 202 degree

17

km/h

Humidity icon

30%

09:30

72

Weather icon

32°

IQAir AirVisual Air Quality Map Wind rotating 217 degree

18

km/h

Humidity icon

23%

10:30

71

Weather icon

34°

IQAir AirVisual Air Quality Map Wind rotating 240 degree

16

km/h

Humidity icon

19%

11:30

70

Weather icon

35°

IQAir AirVisual Air Quality Map Wind rotating 253 degree

17

km/h

Humidity icon

16%

12:30

76

Weather icon

36°

IQAir AirVisual Air Quality Map Wind rotating 258 degree

16

km/h

Humidity icon

14%

13:30

82

Weather icon

37°

IQAir AirVisual Air Quality Map Wind rotating 271 degree

15

km/h

Humidity icon

13%

14:30

89

Weather icon

37°

IQAir AirVisual Air Quality Map Wind rotating 277 degree

13

km/h

Humidity icon

13%

15:30

87

Weather icon

36°

IQAir AirVisual Air Quality Map Wind rotating 281 degree

11

km/h

Humidity icon

13%

16:30

86

Weather icon

36°

IQAir AirVisual Air Quality Map Wind rotating 281 degree

8

km/h

Humidity icon

13%

17:30

85

Weather icon

33°

IQAir AirVisual Air Quality Map Wind rotating 257 degree

6

km/h

Humidity icon

17%

18:30

102

Weather icon

31°

IQAir AirVisual Air Quality Map Wind rotating 246 degree

11

km/h

Humidity icon

18%

19:30

119

Weather icon

30°

IQAir AirVisual Air Quality Map Wind rotating 247 degree

12

km/h

Humidity icon

18%

20:30

137

Weather icon

29°

IQAir AirVisual Air Quality Map Wind rotating 233 degree

11

km/h

Humidity icon

19%

21:30

119

Weather icon

29°

IQAir AirVisual Air Quality Map Wind rotating 207 degree

12

km/h

Humidity icon

19%

22:30

101

Weather icon

28°

IQAir AirVisual Air Quality Map Wind rotating 174 degree

13

km/h

Humidity icon

21%

23:30

84

Weather icon

27°

IQAir AirVisual Air Quality Map Wind rotating 200 degree

13

km/h

Humidity icon

23%

Sat

00:30

83

Weather icon

26°

IQAir AirVisual Air Quality Map Wind rotating 205 degree

13

km/h

Humidity icon

24%

01:30

82

Weather icon

25°

IQAir AirVisual Air Quality Map Wind rotating 213 degree

10

km/h

Humidity icon

27%

02:30

81

Weather icon

24°

IQAir AirVisual Air Quality Map Wind rotating 124 degree

5

km/h

Humidity icon

30%

03:30

82

Weather icon

24°

IQAir AirVisual Air Quality Map Wind rotating 113 degree

12

km/h

Humidity icon

30%

04:30

84

Weather icon

24°

IQAir AirVisual Air Quality Map Wind rotating 138 degree

13

km/h

Humidity icon

31%

05:30

86

Weather icon

24°

IQAir AirVisual Air Quality Map Wind rotating 154 degree

14

km/h

Humidity icon

31%

06:30

90

Weather icon

23°

IQAir AirVisual Air Quality Map Wind rotating 165 degree

13

km/h

Humidity icon

32%

07:30

94

Weather icon

24°

IQAir AirVisual Air Quality Map Wind rotating 178 degree

11

km/h

Humidity icon

32%

08:30

98

Weather icon

27°

IQAir AirVisual Air Quality Map Wind rotating 193 degree

11

km/h

Humidity icon

29%

09:30

87

Weather icon

30°

IQAir AirVisual Air Quality Map Wind rotating 222 degree

14

km/h

Humidity icon

27%

10:30

76

Weather icon

32°

IQAir AirVisual Air Quality Map Wind rotating 233 degree

17

km/h

Humidity icon

22%

11:30

65

Weather icon

34°

IQAir AirVisual Air Quality Map Wind rotating 240 degree

18

km/h

Humidity icon

18%

12:30

67

Weather icon

36°

IQAir AirVisual Air Quality Map Wind rotating 244 degree

20

km/h

Humidity icon

15%

13:30

69

Weather icon

36°

IQAir AirVisual Air Quality Map Wind rotating 241 degree

20

km/h

Humidity icon

14%

14:30

71

Weather icon

36°

IQAir AirVisual Air Quality Map Wind rotating 242 degree

20

km/h

Humidity icon

13%

15:30

70

Weather icon

36°

IQAir AirVisual Air Quality Map Wind rotating 244 degree

20

km/h

Humidity icon

13%

16:30

70

Weather icon

35°

IQAir AirVisual Air Quality Map Wind rotating 248 degree

19

km/h

Humidity icon

13%

17:30

70

Weather icon

33°

IQAir AirVisual Air Quality Map Wind rotating 249 degree

14

km/h

Humidity icon

16%

18:30

70

Weather icon

30°

IQAir AirVisual Air Quality Map Wind rotating 232 degree

14

km/h

Humidity icon

18%

19:30

70

Weather icon

29°

IQAir AirVisual Air Quality Map Wind rotating 224 degree

16

km/h

Humidity icon

21%

20:30

70

Weather icon

29°

IQAir AirVisual Air Quality Map Wind rotating 236 degree

17

km/h

Humidity icon

22%

21:30

66

Weather icon

28°

IQAir AirVisual Air Quality Map Wind rotating 228 degree

16

km/h

Humidity icon

24%

22:30

63

Weather icon

27°

IQAir AirVisual Air Quality Map Wind rotating 210 degree

14

km/h

Humidity icon

25%

23:30

60

Weather icon

26°

IQAir AirVisual Air Quality Map Wind rotating 183 degree

14

km/h

Humidity icon

28%

Sun

00:30

64

Weather icon

26°

IQAir AirVisual Air Quality Map Wind rotating 167 degree

15

km/h

Humidity icon

31%

01:30

68

Weather icon

25°

IQAir AirVisual Air Quality Map Wind rotating 179 degree

14

km/h

Humidity icon

33%

02:30

72

Weather icon

25°

IQAir AirVisual Air Quality Map Wind rotating 182 degree

13

km/h

Humidity icon

33%

03:30

72

Weather icon

25°

IQAir AirVisual Air Quality Map Wind rotating 189 degree

12

km/h

Humidity icon

32%

04:30

72

Weather icon

24°

IQAir AirVisual Air Quality Map Wind rotating 215 degree

13

km/h

Humidity icon

32%

05:30

72

Weather icon

24°

IQAir AirVisual Air Quality Map Wind rotating 223 degree

12

km/h

Humidity icon

32%

06:30

74

Weather icon

24°

IQAir AirVisual Air Quality Map Wind rotating 217 degree

11

km/h

Humidity icon

33%

07:30

76

Weather icon

25°

IQAir AirVisual Air Quality Map Wind rotating 199 degree

10

km/h

Humidity icon

32%

08:30

78

Weather icon

28°

IQAir AirVisual Air Quality Map Wind rotating 209 degree

10

km/h

Humidity icon

27%

09:30

75

Weather icon

30°

IQAir AirVisual Air Quality Map Wind rotating 222 degree

12

km/h

Humidity icon

23%

10:30

73

Weather icon

33°

IQAir AirVisual Air Quality Map Wind rotating 224 degree

14

km/h

Humidity icon

19%

Daily forecast

|

Pali air quality index (AQI⁺) forecast

Air pollutants

What is the current air quality in Pali?

IQAir exclamation icon

PM2.5 concentration is currently 6.3 times the World Health Organization annual PM2.5 guideline value.
Health recommendations

Health recommendations

Most polluted locations near Pali

Worldwide AQI⁺ rankingArrow icon

City ranking

Real-time India AQI⁺ city ranking

#CitiesAQI⁺ US
1
The national flag of India

Gurugram, Haryana

214

2
The national flag of India

Srinagar, Jammu and Kashmir

211

3
The national flag of India

New Delhi, Delhi

193

4
The national flag of India

Delhi, Delhi

191

5
The national flag of India

Sodpur, West Bengal

171

6
The national flag of India

Haldia, West Bengal

170

7
The national flag of India

Kultali, West Bengal

167

8
The national flag of India

Titagarh, West Bengal

164

9
The national flag of India

Mumbai, Maharashtra

163

10
The national flag of India

Raniganj, West Bengal

160

History

Historic air quality graph for Pali

93 AQI⁺ US
Moderate
11:30–12:30 Oct 22 Local time
AQI⁺ US

History

Historic air quality graph for Pali

93 AQI⁺ US
Moderate
11:30–12:30 Oct 22 Local time
AQI⁺ US

Most polluted locations near Pali

Worldwide AQI⁺ rankingArrow icon

City ranking

Real-time India AQI⁺ city ranking

#CitiesAQI⁺ US
1
The national flag of India

Gurugram, Haryana

214

2
The national flag of India

Srinagar, Jammu and Kashmir

211

3
The national flag of India

New Delhi, Delhi

193

4
The national flag of India

Delhi, Delhi

191

5
The national flag of India

Sodpur, West Bengal

171

6
The national flag of India

Haldia, West Bengal

170

7
The national flag of India

Kultali, West Bengal

167

8
The national flag of India

Titagarh, West Bengal

164

9
The national flag of India

Mumbai, Maharashtra

163

10
The national flag of India

Raniganj, West Bengal

160

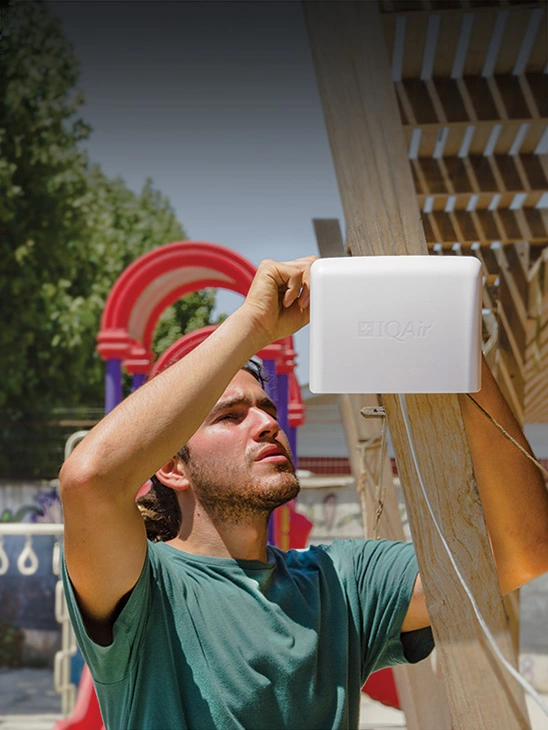
Be the first to measure and contribute air quality data to your community

What is the current air quality in Pali?

The current air quality in Pali is considered moderate. Air quality is acceptable for most people, though sensitive individuals may experience mild symptoms such as coughing or shortness of breath.

What are the pollution levels like in Pali?

Pali is a city found in Rajasthan state in India, having the nickname of being ‘the industrial city’ pertaining to its large amount of factories, industrial areas and manufacturing plants. This alludes to the poorer levels of air quality seen in the city throughout the year, both in more recent times as well as years past. Many industrial processing plants can have a terrible effect on the quality of a cities air, along with many other contributing factors, which will be discussed in the following question.

In short, Pali has some less than desirable levels of air pollution that it could certainly stand to improve upon in the coming years. Of note is that from the year 2018 to 2020, a massive difference was shown, perhaps hinting at a future for the city in which cleaner air quality levels are a more achievable target. In 2018, Pali came in with a PM2.5 reading of 82.3 μg/m³, placing it high in the ‘unhealthy’ ratings bracket, which requires a PM2.5 reading of anywhere between 55.5 to 150.4 μg/m³ to be classified as such.

In 2019 Pali came in with a much improved but still elevated level of PM2.5, presenting with 54.6 μg/m³, sitting at the absolute highest end of the ‘unhealthy for sensitive groups’ bracket, which also requires its own entry at 35.5 to 55.4 μg/m³, showing that in 2019, Pali just eked its way into the bracket, being only a fraction away from moving up to the ‘unhealthy’ rating, as was seen in 2018.

In 2020, Pali came in with a further improved PM2.5 reading of 46.4 μg/m³. This also placed it within the same air quality bracket as 2019, albeit with a decent improvement. This reading of 46.4 μg/m³ also placed Pali in 59th place out of all cities ranked in India over 2020, as well as 133rd place out of all cities ranked worldwide in the same year. As such, even though great improvements were made, Pali is still a city that sits in the upper echelons of most polluted cities seen worldwide.

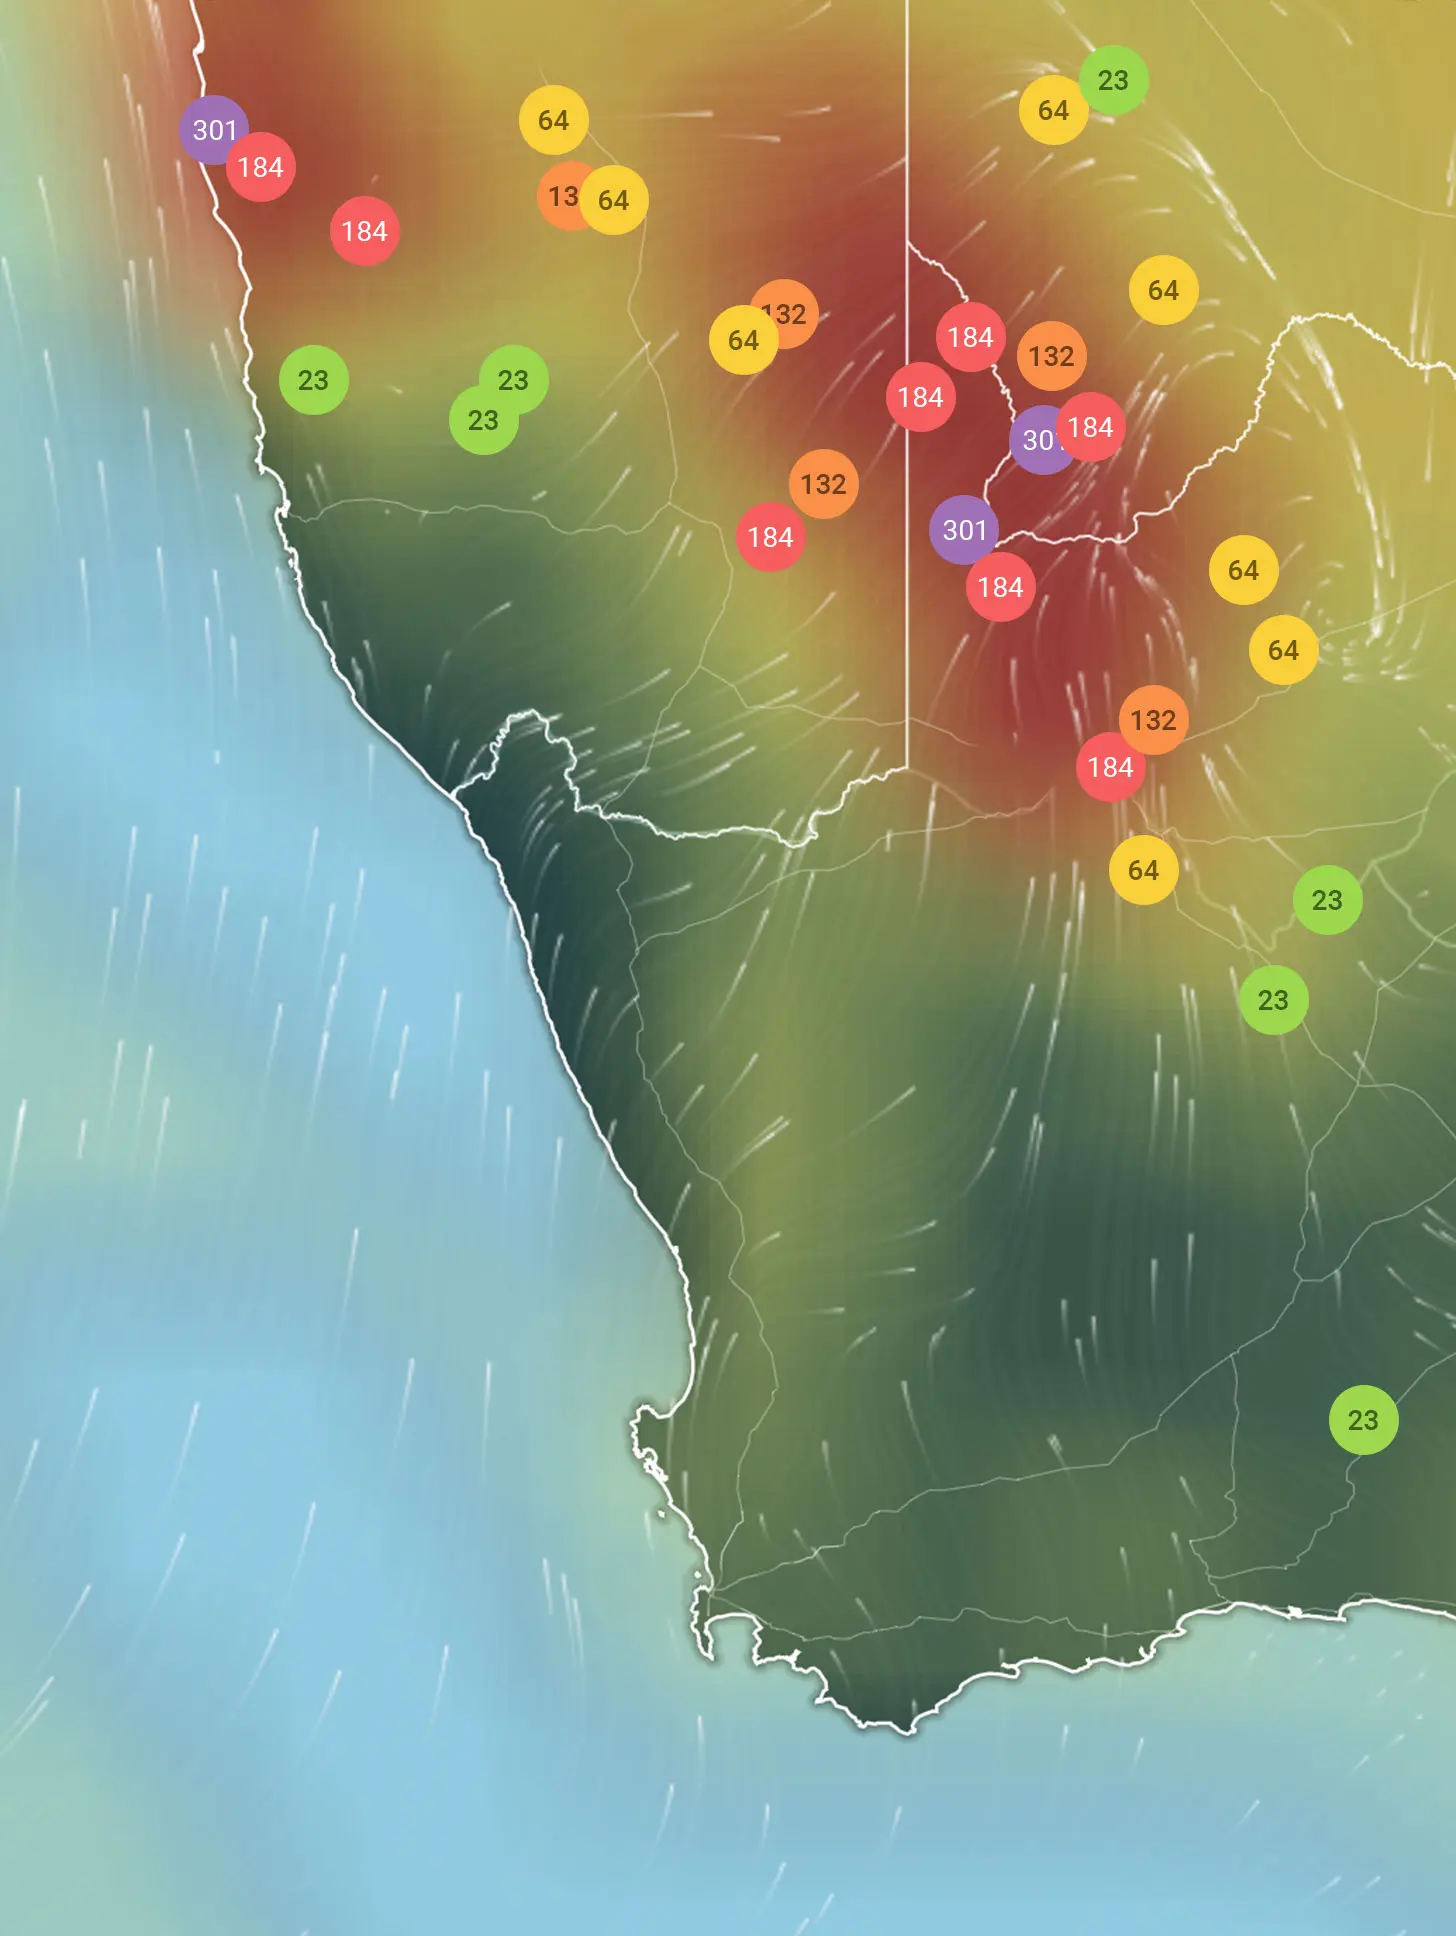
Preventative measures such as the wearing of fine particle filtering masks or avoiding outdoor activity, particularly if it is strenuous, become of the utmost importance, especially during bouts of high pollution. Such spikes in pollution levels can be followed via the air quality map present on this page, as well as through the AirVisual app which can provide individuals with hourly updates on the various levels of pollutants in the air, PM2.5, ozone (O3) and US AQI all included.

Why are there elevated pollution levels in Pali?

Pali has many different sources of air pollution coming together to form the compounded levels seen on record. In Mid-May of 2021, Pali came in with a US AQI reading of 104, placing it within the ‘unhealthy for sensitive groups’ bracket, indicating that the air would be somewhat permeated with amounts of smoke, haze and other contaminating materials, along with clouds of fine (PM2.5) and coarse (PM10) particles.

US AQI is a composite measure of the air pollution levels, with its number based off of the volume of main pollutants typically found in a cities air. It includes some of the already mentioned ones such as ozone and particulate matter, along with nitrogen dioxide (NO2) and sulfur dioxide (SO2). The levels of these pollutants in the air are then used to calculate the US AQI.

Previous days on record in 2021 show that Pali can be subject to more extreme spikes in air pollution, with readings going well up into the ‘unhealthy’ ratings bracket, almost on a daily basis over the months of both April and May. Many readings on record include elevated numbers such as 143, 146 and 149, all in the upper reaches of the unhealthy for sensitive groups bracket, and many others such as 164, 167 and 172, all of which are deemed as unhealthy as per the pollution ratings system.

In order to reach such high levels of air pollution, the numerous sources that put out constant streams of chemical compounds and hazardous particulate matter would come from ones such as the many factories, power plants and industrial facilities within the city. Other sources stem from anthropogenic activity, particularly in lower income districts as well as being introduced to the city from surrounding rural areas, with clouds of smoke being blown in by the wind.

These sources often come from people relying on traditional methods of both cooking and heating by burning materials such as animal dung, firewood and charcoal, all of which can release many dangerous pollutants, especially when produced from countless households. Other sources of note are construction sites, vehicular emissions, and road repairs, all of which can produce their own pollutants and fine particle contamination.

When does air quality become worse in Pali?

Observing the air quality data collected over 2020, one can see that Pali had a fairly consistent level of air pollution throughout the entire year, which differs from many other cities in India and indeed other countries in the region, which typically see very clear cut high and low periods of PM2.5 readings.

For the months that can be singled out however, January, February, May, October and November all had the highest readings of pollution, showing the sporadic nature of PM2.5 readings occurring in Pali. The most polluted month out of all of these was February, with a reading of 57.8 μg/m³.

When does the air quality clear up in Pali?

As mentioned above, when looking at the air quality data from times past, it seems that pollution levels are somewhat relentless in Pali, never having a period in which they drop by a significant amount. However, if one were to pick out the cleanest months of the year, March, April, July and August all came in with the lowest readings of PM2.5, with August having the cleanest reading at 35.6 μg/m³.

What are some of the health problems that come from breathing from pollution in Pali?

Health problems that would arise from being exposed to excessive amounts of air pollution in Pali would be ones such as pneumonia, bronchitis, emphysema and asthma, all conditions that fall under the chronic obstructive pulmonary disease (COPD) bracket. Other symptoms would be irritation to both the skin and mucous membranes, with the skin being highly sensitive towards certain chemical pollutants, particularly in some individuals.

Incidences of psoriasis, acne, eczema and atopic dermatitis may present themselves, along with skin cancer. Cancer of the lungs would also rise dramatically along with pollution levels, showing the ever present need to improve the cities air quality and thus the life of its citizens.

Where is the cleanest air quality in Pali?

No locations are available.