WorldArrow icon
Arrow iconLeganes

Air quality in Leganes

Air quality index (AQI⁺) and PM2.5 air pollution in Leganes • 1.5K Followers • 13:00, Oct 22 Local time

39

US AQI⁺

Good

face expression based on aqi value

Main pollutant:

PM2.5

7.2 µg/m³

weather condition icon

17°

wind direction icon

10 km/h

weather humid icon

44 %

Hourly forecast

Leganes air quality index (AQI⁺) forecast

Now

39

Weather icon

17°

IQAir AirVisual Air Quality Map Wind rotating 228 degree

10

km/h

Humidity icon

44%

16:00

36

Weather icon

18°

IQAir AirVisual Air Quality Map Wind rotating 233 degree

11

km/h

Humidity icon

45%

17:00

34

Weather icon

18°

IQAir AirVisual Air Quality Map Wind rotating 238 degree

12

km/h

Humidity icon

43%

18:00

33

Weather icon

18°

IQAir AirVisual Air Quality Map Wind rotating 242 degree

12

km/h

Humidity icon

37%

19:00

32

Weather icon

17°

IQAir AirVisual Air Quality Map Wind rotating 239 degree

10

km/h

Humidity icon

43%

20:00

26

Weather icon

15°

IQAir AirVisual Air Quality Map Wind rotating 223 degree

6

km/h

Humidity icon

57%

21:00

24

Weather icon

14°

IQAir AirVisual Air Quality Map Wind rotating 224 degree

6

km/h

Humidity icon

65%

22:00

23

Weather icon

14°

IQAir AirVisual Air Quality Map Wind rotating 222 degree

6

km/h

Humidity icon

69%

23:00

30

Weather icon

13°

IQAir AirVisual Air Quality Map Wind rotating 232 degree

6

km/h

Humidity icon

70%

Fri

00:00

29

Weather icon

12°

IQAir AirVisual Air Quality Map Wind rotating 223 degree

6

km/h

Humidity icon

72%

01:00

28

Weather icon

12°

IQAir AirVisual Air Quality Map Wind rotating 233 degree

6

km/h

Humidity icon

73%

02:00

34

Weather icon

11°

IQAir AirVisual Air Quality Map Wind rotating 238 degree

7

km/h

Humidity icon

73%

03:00

34

Weather icon

11°

IQAir AirVisual Air Quality Map Wind rotating 244 degree

8

km/h

Humidity icon

73%

04:00

34

Weather icon

11°

IQAir AirVisual Air Quality Map Wind rotating 249 degree

9

km/h

Humidity icon

71%

05:00

31

Weather icon

12°

IQAir AirVisual Air Quality Map Wind rotating 254 degree

9

km/h

Humidity icon

67%

06:00

31

Weather icon

11°

IQAir AirVisual Air Quality Map Wind rotating 258 degree

9

km/h

Humidity icon

67%

07:00

31

Weather icon

11°

IQAir AirVisual Air Quality Map Wind rotating 255 degree

8

km/h

Humidity icon

68%

08:00

26

Weather icon

11°

IQAir AirVisual Air Quality Map Wind rotating 250 degree

7

km/h

Humidity icon

71%

09:00

26

Weather icon

10°

IQAir AirVisual Air Quality Map Wind rotating 264 degree

8

km/h

Humidity icon

73%

10:00

26

Weather icon

12°

IQAir AirVisual Air Quality Map Wind rotating 279 degree

11

km/h

Humidity icon

70%

11:00

26

Weather icon

14°

IQAir AirVisual Air Quality Map Wind rotating 294 degree

14

km/h

Humidity icon

54%

12:00

26

Weather icon

15°

IQAir AirVisual Air Quality Map Wind rotating 311 degree

13

km/h

Humidity icon

46%

13:00

26

Weather icon

17°

IQAir AirVisual Air Quality Map Wind rotating 320 degree

8

km/h

Humidity icon

43%

14:00

32

Weather icon

18°

IQAir AirVisual Air Quality Map Wind rotating 313 degree

6

km/h

Humidity icon

40%

15:00

32

Weather icon

18°

IQAir AirVisual Air Quality Map Wind rotating 305 degree

6

km/h

Humidity icon

38%

16:00

32

Weather icon

19°

IQAir AirVisual Air Quality Map Wind rotating 290 degree

6

km/h

Humidity icon

34%

17:00

27

Weather icon

19°

IQAir AirVisual Air Quality Map Wind rotating 295 degree

8

km/h

Humidity icon

32%

18:00

27

Weather icon

18°

IQAir AirVisual Air Quality Map Wind rotating 302 degree

5

km/h

Humidity icon

29%

19:00

27

Weather icon

18°

IQAir AirVisual Air Quality Map Wind rotating 309 degree

4

km/h

Humidity icon

30%

20:00

21

Weather icon

16°

IQAir AirVisual Air Quality Map Wind rotating 357 degree

2

km/h

Humidity icon

39%

21:00

21

Weather icon

14°

IQAir AirVisual Air Quality Map Wind rotating 3 degree

3

km/h

Humidity icon

45%

22:00

21

Weather icon

13°

IQAir AirVisual Air Quality Map Wind rotating 69 degree

4

km/h

Humidity icon

54%

23:00

29

Weather icon

12°

IQAir AirVisual Air Quality Map Wind rotating 45 degree

3

km/h

Humidity icon

55%

Sat

00:00

29

Weather icon

11°

IQAir AirVisual Air Quality Map Wind rotating 16 degree

3

km/h

Humidity icon

56%

01:00

29

Weather icon

10°

IQAir AirVisual Air Quality Map Wind rotating 346 degree

3

km/h

Humidity icon

57%

02:00

41

Weather icon

10°

IQAir AirVisual Air Quality Map Wind rotating 344 degree

3

km/h

Humidity icon

58%

03:00

41

Weather icon

9°

IQAir AirVisual Air Quality Map Wind rotating 340 degree

4

km/h

Humidity icon

59%

04:00

41

Weather icon

9°

IQAir AirVisual Air Quality Map Wind rotating 351 degree

3

km/h

Humidity icon

62%

05:00

38

Weather icon

8°

IQAir AirVisual Air Quality Map Wind rotating 274 degree

2

km/h

Humidity icon

63%

06:00

38

Weather icon

8°

IQAir AirVisual Air Quality Map Wind rotating 349 degree

3

km/h

Humidity icon

62%

07:00

38

Weather icon

7°

IQAir AirVisual Air Quality Map Wind rotating 357 degree

3

km/h

Humidity icon

68%

08:00

33

Weather icon

6°

IQAir AirVisual Air Quality Map Wind rotating 347 degree

3

km/h

Humidity icon

71%

09:00

33

Weather icon

6°

IQAir AirVisual Air Quality Map Wind rotating 17 degree

1

km/h

Humidity icon

74%

10:00

33

Weather icon

7°

IQAir AirVisual Air Quality Map Wind rotating 54 degree

2

km/h

Humidity icon

72%

11:00

42

Weather icon

9°

IQAir AirVisual Air Quality Map Wind rotating 42 degree

2

km/h

Humidity icon

64%

12:00

42

Weather icon

12°

IQAir AirVisual Air Quality Map Wind rotating 140 degree

3

km/h

Humidity icon

54%

13:00

42

Weather icon

14°

IQAir AirVisual Air Quality Map Wind rotating 186 degree

6

km/h

Humidity icon

45%

14:00

58

Weather icon

16°

IQAir AirVisual Air Quality Map Wind rotating 203 degree

7

km/h

Humidity icon

40%

15:00

58

Weather icon

17°

IQAir AirVisual Air Quality Map Wind rotating 221 degree

10

km/h

Humidity icon

37%

16:00

58

Weather icon

18°

IQAir AirVisual Air Quality Map Wind rotating 236 degree

10

km/h

Humidity icon

36%

17:00

45

Weather icon

19°

IQAir AirVisual Air Quality Map Wind rotating 237 degree

11

km/h

Humidity icon

33%

18:00

45

Weather icon

18°

IQAir AirVisual Air Quality Map Wind rotating 238 degree

11

km/h

Humidity icon

34%

19:00

45

Weather icon

18°

IQAir AirVisual Air Quality Map Wind rotating 245 degree

9

km/h

Humidity icon

34%

20:00

33

Weather icon

16°

IQAir AirVisual Air Quality Map Wind rotating 239 degree

7

km/h

Humidity icon

43%

21:00

33

Weather icon

14°

IQAir AirVisual Air Quality Map Wind rotating 236 degree

7

km/h

Humidity icon

44%

22:00

33

Weather icon

13°

IQAir AirVisual Air Quality Map Wind rotating 244 degree

7

km/h

Humidity icon

47%

23:00

21

Weather icon

13°

IQAir AirVisual Air Quality Map Wind rotating 248 degree

8

km/h

Humidity icon

51%

Sun

00:00

21

Weather icon

12°

IQAir AirVisual Air Quality Map Wind rotating 246 degree

7

km/h

Humidity icon

54%

01:00

21

Weather icon

11°

IQAir AirVisual Air Quality Map Wind rotating 248 degree

7

km/h

Humidity icon

57%

02:00

22

Weather icon

11°

IQAir AirVisual Air Quality Map Wind rotating 251 degree

6

km/h

Humidity icon

62%

02:00

22

Weather icon

10°

IQAir AirVisual Air Quality Map Wind rotating 257 degree

5

km/h

Humidity icon

65%

03:00

22

Weather icon

10°

IQAir AirVisual Air Quality Map Wind rotating 260 degree

4

km/h

Humidity icon

67%

04:00

23

Weather icon

9°

IQAir AirVisual Air Quality Map Wind rotating 263 degree

3

km/h

Humidity icon

69%

05:00

23

Weather icon

9°

IQAir AirVisual Air Quality Map Wind rotating 258 degree

3

km/h

Humidity icon

71%

06:00

23

Weather icon

8°

IQAir AirVisual Air Quality Map Wind rotating 290 degree

2

km/h

Humidity icon

73%

07:00

24

Weather icon

8°

IQAir AirVisual Air Quality Map Wind rotating 336 degree

2

km/h

Humidity icon

76%

08:00

24

Weather icon

8°

IQAir AirVisual Air Quality Map Wind rotating 14 degree

2

km/h

Humidity icon

78%

09:00

24

Weather icon

8°

IQAir AirVisual Air Quality Map Wind rotating 5 degree

2

km/h

Humidity icon

76%

10:00

21

Weather icon

11°

IQAir AirVisual Air Quality Map Wind rotating 61 degree

2

km/h

Humidity icon

66%

11:00

21

Weather icon

14°

IQAir AirVisual Air Quality Map Wind rotating 100 degree

2

km/h

Humidity icon

55%

12:00

21

Weather icon

16°

IQAir AirVisual Air Quality Map Wind rotating 143 degree

1

km/h

Humidity icon

48%

13:00

35

Weather icon

18°

IQAir AirVisual Air Quality Map Wind rotating 248 degree

2

km/h

Humidity icon

46%

Daily forecast

|

Leganes air quality index (AQI⁺) forecast

Air pollutants

What is the current air quality in Leganes?

IQAir exclamation icon

PM2.5 concentration is currently 1.4 times the World Health Organization annual PM2.5 guideline value.
Health recommendations

Pollen

What is the pollen count in Leganes today?

Index

Pollen global icon

None

Pollen tree icon

Tree

None

0%
Pollen grass icon

Grass

None

0%
Pollen weed icon

Weed

None

0%
Pollen forecast in Leganes

Health recommendations

Pollen

What is the pollen count in Leganes today?

Index

Pollen global icon

None

Pollen tree icon

Tree

None

0%
Pollen grass icon

Grass

None

0%
Pollen weed icon

Weed

None

0%
Pollen forecast in Leganes

Most polluted locations near Leganes

Worldwide AQI⁺ rankingArrow icon

Station ranking

Real-time AQI⁺ station ranking for stations in Leganes

#StationsAQI⁺ US
1
The national flag of Spain

Leganés Station

39

City ranking

Real-time Spain AQI⁺ city ranking

#CitiesAQI⁺ US
1
The national flag of Spain

Melilla, Melilla

67

2
The national flag of Spain

Amorebieta, Basque Country

60

3
The national flag of Spain

Sevilla, Andalusia

60

4
The national flag of Spain

Aviles, Asturias

58

5
The national flag of Spain

Gijon, Asturias

53

6
The national flag of Spain

Zaragoza, Aragon

53

7
The national flag of Spain

Bilbo, Basque Country

50

8
The national flag of Spain

Huelva, Andalusia

47

9
The national flag of Spain

Lasarte, Basque Country

47

10
The national flag of Spain

La Linea de la Concepcion, Andalusia

46

History

Historic air quality graph for Leganes

39 AQI⁺ US
Good
12:00–13:00 Oct 22 Local time
AQI⁺ US

History

Historic air quality graph for Leganes

39 AQI⁺ US
Good
12:00–13:00 Oct 22 Local time
AQI⁺ US

Most polluted locations near Leganes

Worldwide AQI⁺ rankingArrow icon

Station ranking

Real-time AQI⁺ station ranking for stations in Leganes

#StationsAQI⁺ US
1
The national flag of Spain

Leganés Station

39

City ranking

Real-time Spain AQI⁺ city ranking

#CitiesAQI⁺ US
1
The national flag of Spain

Melilla, Melilla

67

2
The national flag of Spain

Amorebieta, Basque Country

60

3
The national flag of Spain

Sevilla, Andalusia

60

4
The national flag of Spain

Aviles, Asturias

58

5
The national flag of Spain

Gijon, Asturias

53

6
The national flag of Spain

Zaragoza, Aragon

53

7
The national flag of Spain

Bilbo, Basque Country

50

8
The national flag of Spain

Huelva, Andalusia

47

9
The national flag of Spain

Lasarte, Basque Country

47

10
The national flag of Spain

La Linea de la Concepcion, Andalusia

46

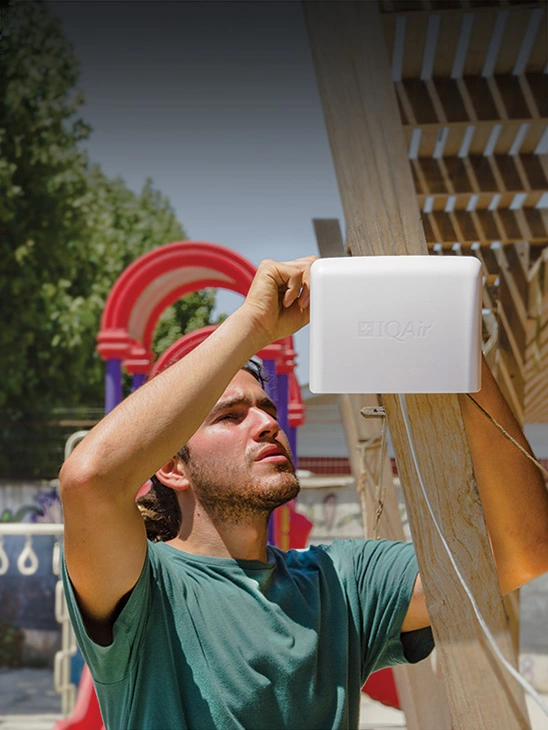
Measure your own air quality

Get a monitor and contribute air quality data in your city.

What is the current air quality in Leganes?

The current air quality in Leganes is considered good. Air pollution levels are low and there are no expected health risks, making it a good time to enjoy normal outdoor activities.

What is the current level of air pollution in Leganés?

Leganés is a city in the Community of Madrid, Spain. Considered part of the Madrid metropolitan area, it is located about 11 kilometres southwest of the city centre. According to a survey conducted in2018, Leganés had an estimated population of approximately 188,500 inhabitants. This ranked it as the fifth most populous municipality.

Towards the end of 2021, Leganés was going through a period of “Moderate” air quality with a US AQI reading of 61. This reading is often used as a reference point when comparing air quality in other cities around the world. Data is collected with regards to the six most prolific air pollutants commonly found and this figure is calculated from there. If information is not available for all six, then a figure can be deduced using the information that is available. For Leganés, there were four pollutants measured which were; PM2.5 - 17 µg/m³, PM10 - 25 µg/m³, ozone (O3) - 25 µg/m³ and nitrogen dioxide (NO2) - 47 µg/m³.

The level of PM2.5 can be seen to be just over one and a half times higher than the suggested level of 10 µg/m³. This level has been determined by the World Health Organisation (WHO) as being an acceptable level of air pollution, although no level is to be considered as being safe.

When the air quality is classified as being “Moderate”, the given advice would be to remain indoors as much as possible and close all doors and windows to prevent more polluted air from getting inside. Those who are more sensitive to poor air quality should avoid going outside until the air quality improves. If this is unavoidable, then a good quality mask should be worn at all times. All groups are dissuaded from partaking in vigorous outdoor exercise. There is a downloadable app from AirVisual which is available for most operating systems which informs the user of real-time air quality which can be useful information to help decide what to do.

Does the air quality vary throughout the year in Leganés?

Looking back at the figures published by IQAir.com for 2020, the months of the year were very disjointed. January and February, July and November all returned figures from the “Moderate” category between 12.1 and 35.4 µg/m³. The months of June, August, September and December all offered “Good” readings between 10 and 12 µg/m³. The remaining months of March, April and May, together with October all achieved less than the target figure of 10 µg/m³ as recommended by the WHO.

Records for air quality were first kept in 2019 when the air quality was recorded as being “Good” with a figure of 12 µg/m³. A slight deterioration was seen in 2020 when that figure was 13 µg/m³ which pushed it into the “Moderate” bracket. However, the figures for 2020 were not always what they seem because of the COVID-19 pandemic. Many cities throughout the world reported much cleaner air in their centres because of the lack of vehicles using the roads on a daily basis. There were also some factories and small production units which were temporarily closed so their emissions were halted.

Where does the air pollution come from in Leganés?

Road traffic is the cause that leads the ranking of pollutant sources in the city of Leganés. The residential, commercial and institutional sector, which refers mainly to non-industrial air conditioning systems, which represent 18.1 per cent of nitrogen oxide emissions. Finally, the industrial sector comes next without reaching 7 per cent of emissions.

Recently, the measurement stations in Leganés and other nearby points have collected high values of PM10 and PM2.5 particles and nitrogen dioxide, but not so high as to activate the municipal protocol. The technical services of the Sustainability Delegation report that the cold temperature situation with thermal inversion is responsible for the PM10 and PM2.5 particles having reached high values. Meteorological stability does not allow the dispersion of pollutants, which is why their concentrations are increasing as a result of road traffic, amongst other causes.

Can anything be done to improve air quality in Leganés?

With the aim of improving pollution levels and therefore the quality of the air breathed, the City Council is developing Plan A, which includes 21 measures related to traffic, but also others related to other sectors, such as the elimination of coal.

In 2018, 18 diesel boilers were eliminated from municipal buildings and facilities, which meant eliminating 67 per cent of current diesel consumption. In 2019, diesel boilers were mainly history in the city environs.

Methane is a very powerful climate pollutant, as well as an atmospheric pollutant associated with agricultural activities, closely intertwined with livestock production and meat consumption. Particulate matter is another pollutant that affects both climate change and air quality. Depending on its composition, it can have a cooling or warming effect on the local and global climate. For example, black carbon, which is one of the components of fine particulate matter and the result of incomplete combustion of fuels, absorbs solar and infrared radiation in the atmosphere and therefore causes a warming effect.

What are the effects of air pollution on health?

Outdoor ambient air pollution is a broader term used to describe air pollution in outdoor environments. Poor outdoor ambient air quality occurs when pollutants reach concentrations high enough to negatively affect human health and / or the environment. Outdoor urban air pollution is a more specific term that refers to outdoor ambient air pollution in urban areas, usually in or around cities.

Exposure to high levels of air pollution can cause a variety of adverse health outcomes. Air pollution can increase the risk of respiratory infections, heart disease, stroke, and lung cancer. Both short-term and long-term exposure to air pollutants has been associated with adverse health impacts. The most severe impacts affect people who are already sick. Children, the elderly and the poor are most susceptible. The most harmful pollutants for health, closely associated with excessive premature mortality, are fine PM2.5 particles that penetrate deep into the lung ducts.

Particulate matter (PM) is the term for particles that are suspended in the air, such as dust, soot, smoke and aerosol. Large amounts of particulate matter are typically emitted from sources such as diesel vehicles, burning waste and crops and coal-fired power plants.

Particles less than 10 microns in diameter (PM10) present a health problem because they can be inhaled and accumulate in the respiratory system. Particles less than 2.5 microns in diameter (PM2.5) are called "fine" particles and pose greater health risks. Due to its small size, fine particles can lodge deep in the lungs.

Where is the cleanest air quality in Leganes?