Add
Air quality in Marina del Rey
Air quality index (AQI⁺) and PM2.5 air pollution in Marina del Rey • 34.3K Followers • 04:00, Nov 15

27*
US AQI⁺Good

Main pollutant:
PM2.5
4.9 µg/m³

15°

9 km/h

62 %
Hourly forecast
Marina del Rey air quality index (AQI⁺) forecast


Daily forecast
Marina del Rey air quality index (AQI⁺) forecast
| Today | 34 |  | 22° 18° |  12 km/h | 59% |
| Mon | 25 |  | 20° 18° | 34 km/h | 65% |
| Tue | 35 | | 19° 15° | 27 km/h | 48% |
Air pollutants
What is the current air quality in Marina del Rey?

PM2.5 concentration currently meets the WHO annual PM2.5 guideline.
Health recommendations
 Enjoy outdoor activities |
 Open your windows to bring clean, fresh air indoors Get a monitor |
Pollen
What is the pollen count in Marina del Rey today?
Index

Low
 Tree Low | 25% |
 Grass None | 0% |
 Weed Low | 25% |
Source:
wetter.comHealth recommendations
Enjoy outdoor activities |
Open your windows to bring clean, fresh air indoors Get a monitor |
Pollen
What is the pollen count in Marina del Rey today?
Index
Low
Tree Low | 25% |
Grass None | 0% |
Weed Low | 25% |
Source:
wetter.comMost polluted locations near Marina del Rey
Worldwide AQI⁺ ranking

Historic air quality near Marina del Rey
History
Historic air quality graph for Marina del Rey
Historic air quality near Marina del Rey
History
Historic air quality graph for Marina del Rey
Most polluted locations near Marina del Rey
Worldwide AQI⁺ ranking


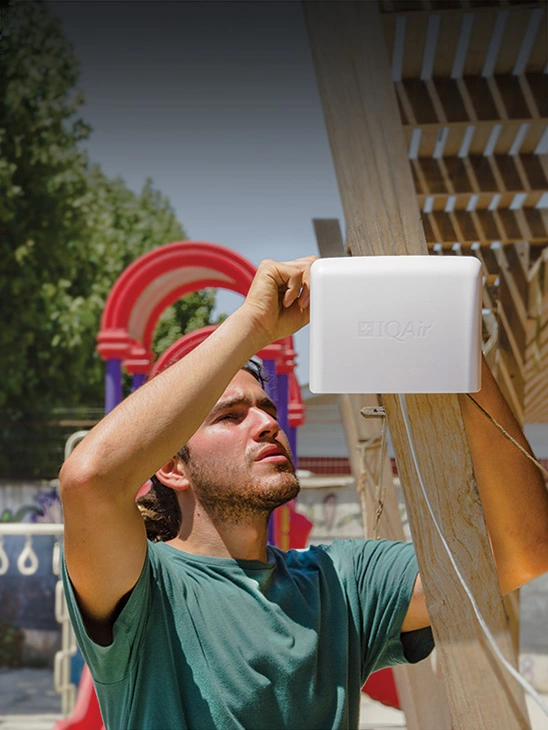
Be the first to measure and contribute air quality data to your community


Learn more about air pollution in Marina del Rey
What is the current air quality in Marina del Rey?
The current air quality in Marina del Rey is considered good. Air pollution levels are low and there are no expected health risks, making it a good time to enjoy normal outdoor activities.
How is the air quality in Marina Del Rey?
Located in the coastal region of upscale West Los Angeles and ten minutes from Santa Monica’s renowned beaches, Marina Del Rey’s sprawling urban marina is home to 5-star waterfront hotels and more than 50 restaurants. Air quality in Marina Del Rey generally varies from good to moderate, as evidenced by 2019 monthly reports ranging from AQI 27 (good) in March to AQI 63 (moderate) in December.
As Marina Del Rey is part of greater Los Angeles, it is susceptible to transboundary air pollution, as Los Angeles County air pollution ranks among the nation’s worst for both ozone and PM2.5. The American Lung Association (ALA) 2020 State of the Air Report shows dismal numbers for air quality across Los Angeles County. While the US EPA targets an annual allowance of no more than 3.2 unhealthy pollution days a year, Los Angeles County averages:1
- 111 unhealthy ozone days per year.
- 13.8 unhealthy PM2.5 days per year.
While ozone is most frequently at unhealthy levels, fine particulate matter (PM2.5) has also played a significant role in contaminating air quality across Marina Del Rey. The term “PM” refers to particles found in the air, and PM2.5 signifies that these elements are 2.5 micrometers or less. Composed of tiny particles found in the air — including dust, soot, dirt, smoke, and liquid droplets — these miniscule elements can remain airborne for long periods of time and easily be absorbed into the bloodstream upon inhalation. PM2.5 often poses the greatest health threat among all commonly measured air pollutants due to its prevalence at dangerous levels and ability to affect a number of organs once inhaled.
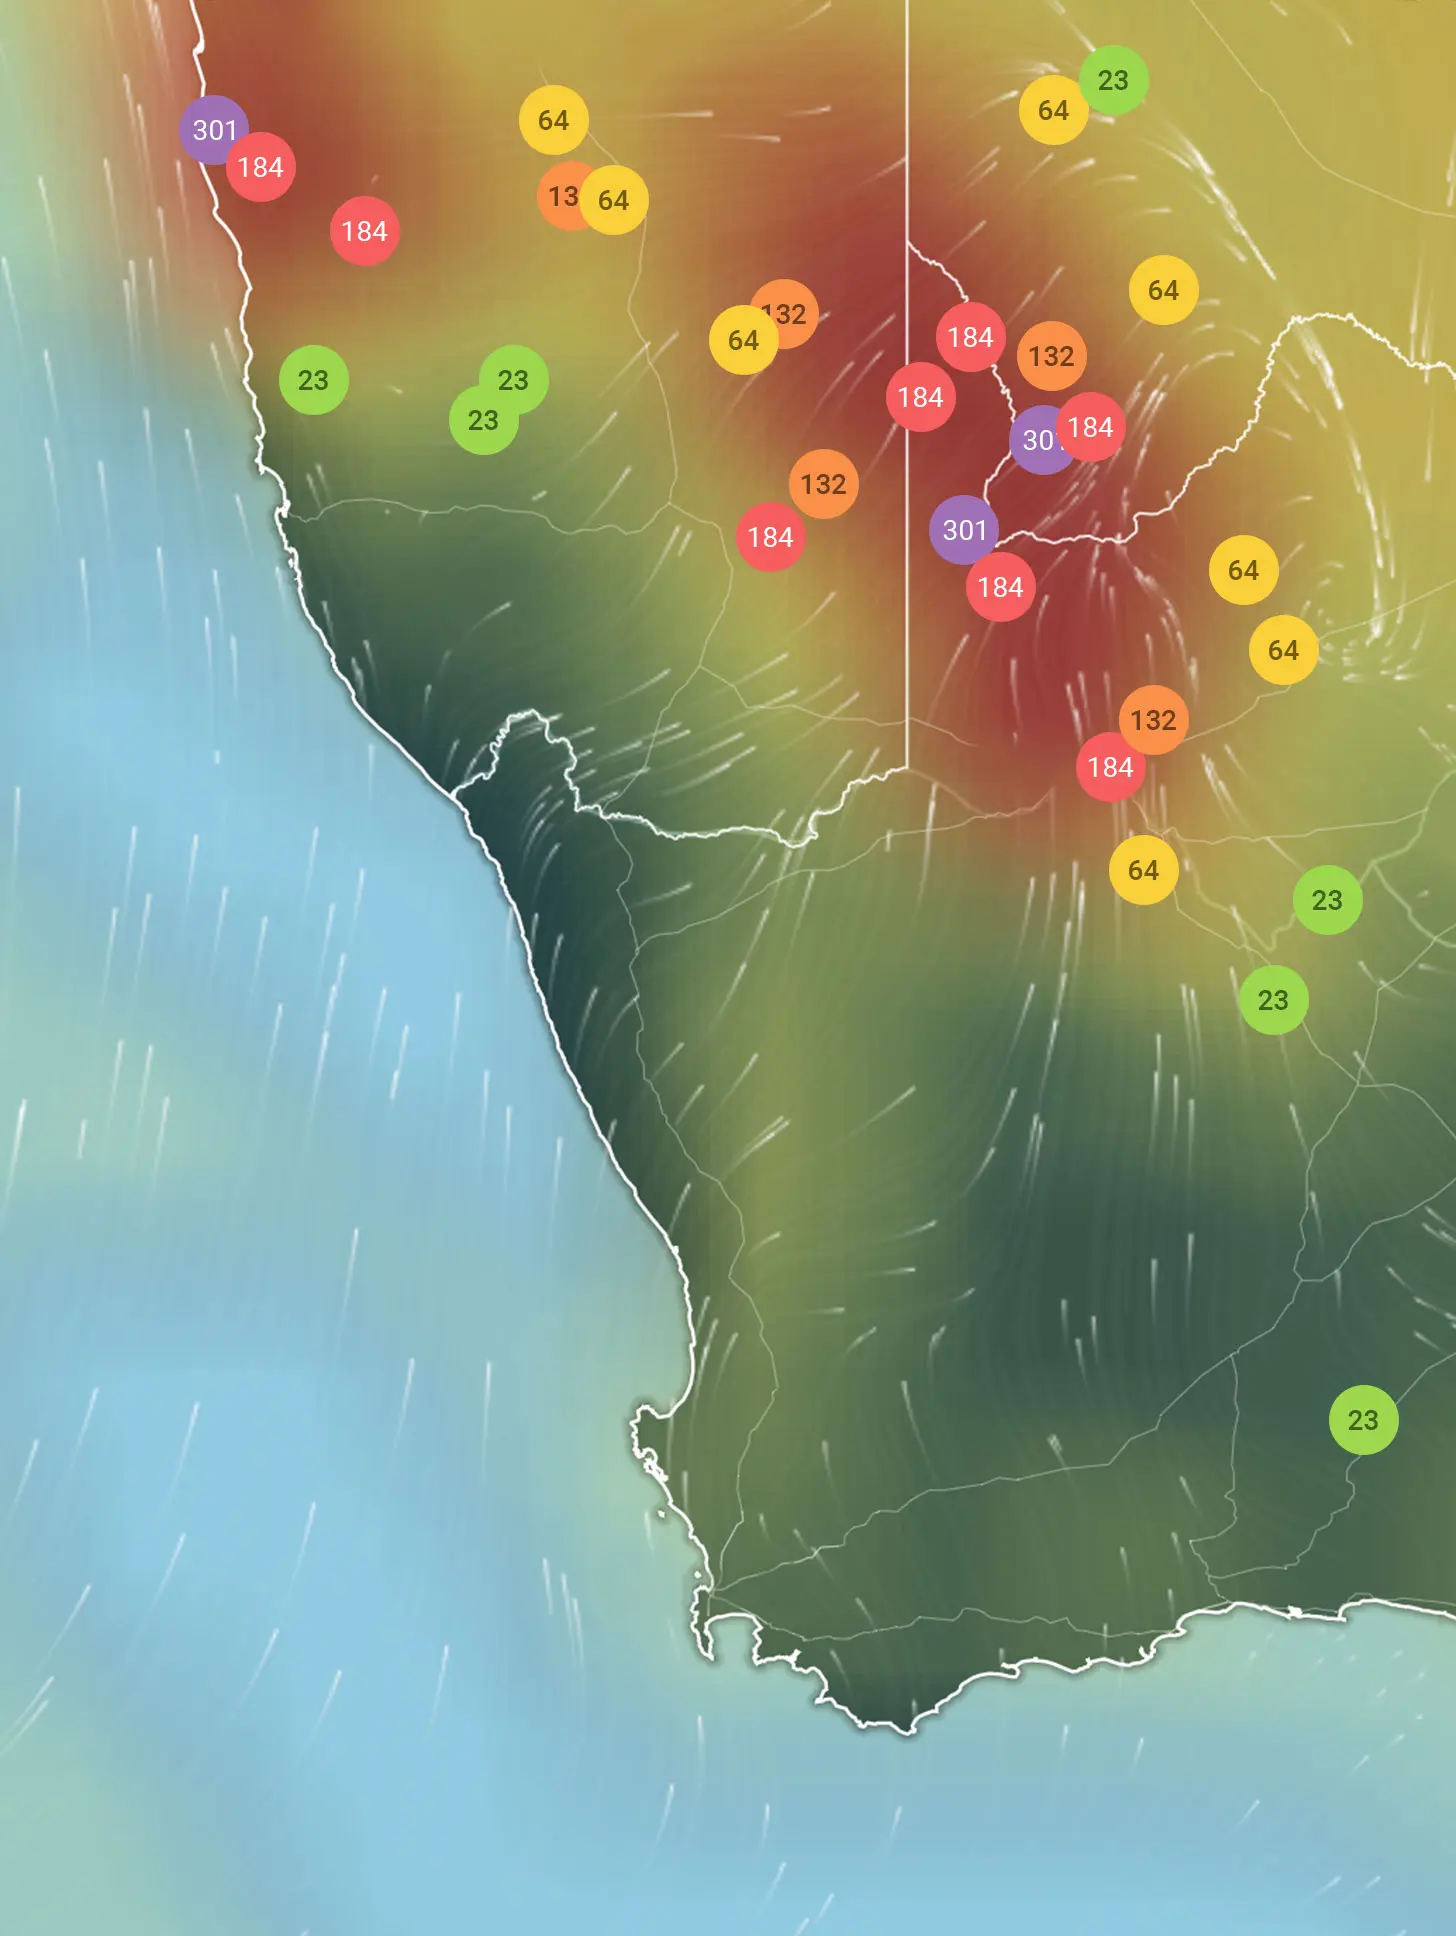
As a coastal town, Marina Del Rey is usually shielded from surrounding L.A. County’s poor air quality by swirling ocean breezes that blow in clean air from the Pacific and push pollutants further down the coast or out to sea. These pollutants can also be blown east towards the mountains, compounding the bad air quality in those regions. Cities such as Redlands, San Bernardino, and the tiny mountain community of Crestline generally have far worse air quality than coastal cities like Long Beach or Santa Monica. To illustrate the glaring disparities between air quality across the region, between June and September, Crestline suffered 94 days of smoggy air. while Long Beach had none.2
Marina Del Rey and its immediate surrounding area, which includes Santa Monica and Venice, has a combined population of roughly 90,000, and some major thoroughfares that cut through these areas withstand heavy traffic on any given day. U.S. Interstate 10 and Pacific Coast Highway are two major highways that service millions of travelers and commuters each year, and emissions from these vehicles fill the air with pollutants that can degrade the air quality even in coastal Marina Del Rey.3 The two main components of car exhaust are hydrocarbons from gasoline and nitrogen oxides formed inside hot, internal combustion engines; when these harmful substances are emitted into the warm Southern California air, the heat from the sun bakes them into ozone, a key component of smog. Smog has diminished in the L.A. Basin in recent years, and peak smog levels are lower as well. 2017 had 145 days of unhealthy air compared to well over 200 in the late 1980s. Smog occurrence is not as severe as it once was, but it remains a far cry from federal standards, which allow no more than 3.2 unhealthy ozone days a year.4 Los Angeles County still ranks for worst smog levels in the country.
Because of its proximity to the ocean, Marina Del Rey air quality has fared somewhat better than its neighbors in surrounding areas of greater Los Angeles, and even though overall trends show improvements in air quality in the area, there are still days when residents at risk of health concerns should take precautions because of bad air quality. Residents who suffer from such maladies as lung cancer, asthma, COPD, and cardiovascular disease should stay attuned to predictive air quality data regarding air pollutions levels in Marina Del Rey and surrounding cities.
When are pollution levels in Marina Del Rey the highest?
Vehicle emissions are the heaviest contributors to pollution in Marina Del Rey. Motor engines release PM2.5 as well as nitrogen dioxide (NO2), a precursor pollutant to ozone.5 As sunlight and heat become more abundant in the summer, creating ideal conditions for ozone formation, smog becomes more pervasive and dangerous. Summer months also bring tourists to Marina Del Rey’s upscale restaurants, nautical recreation, and luxury hotels. With the heavy incursion of commuter traffic and tens of thousands of tourists and visitors to the area, Marina Del Rey and environs can experience an influx of more than 200,000 people on any given day during its busy summer season, increasing PM2.5 levels as a result of elevated vehicular emissions. With a general AQI ranging around 60 during the summer months, Santa Monica, Venice, and Marina Del Rey are considered to have moderate air quality, but there are still days when pollution levels rise and people with health issues may have to take precautions.
Marina Del Rey also experiences a phenomenon known as marine inversions. This type of inversion occurs when a layer of warmer air in the upper atmosphere traps cooler air in the lower atmosphere, which may contain contaminants. Marina Del Rey’s marine inversions can be problematic, increasing ozone and PM2.5 levels.
Is air quality in Marina Del Rey improving?
Santa Monica and neighboring coastal cities have made concerted efforts to reduce pollution emission. Efforts have included:6
- Increased efficiency in vehicle fuel
- Increased renewable energy for electricity generation
- Reduced waste in landfill areas
- A decline in natural gas consumption
- Reduced aviation activity
Vehicle transportation remains the largest source of harmful emissions (24 percent), but by 2040, emissions in the Santa Monica/Venice/Marina Del Rey area could decline to 40 percent below 1990 levels through statewide policies and increased renewable grid electricity.
Despite the growth in population, many people are driving less, and when they do drive, they are traveling in more fuel-efficient or electric vehicles. Efforts in increasing renewable energy sources in the electricity grid and improving vehicle fuel efficiency have been paying off, especially with the addition of traffic-reducing bus lines and the Metro Rail. A 2018 Northwest Coastal L.A. County area report showed only two days where 8-hour average ozone concentrations surpassed the .07 ppm threshold. The 2020 target is zero days of unhealthy ozone levels.
What causes smog in Marina Del Rey?
Although Marina Del Rey gets a break from heightened smog levels that generally plague Los Angeles County, it still experiences smog because of traffic conditions and other variables. Marina Del Rey and its immediate environs is home to more than 90,000 residents, which doesn’t include the multitudes of commuters who traverse the local thoroughfares on a daily basis. Marina Del Rey also has close proximity to some of the busiest ports in the country, and tens of thousands of heavy-diesel trucks make their way across these highways each day.
The mountains that surround the Los Angeles Basin also regularly trap pollution as it gets pushed into the area by coastal winds. Sea breezes often move pollution eastward out of the vicinity of Marina Del Rey; however, at other times, winds can push pollutants from Los Angeles out to sea, directly affecting the Marina and surrounding communities.
Summer months with heightened traffic conditions brought on by tourists visiting the area increase nitrogen dioxide (NO2) emission levels, spiking ozone pollution in the Marina Del Rey area. Nearly three out of every four days in L.A. are sunny and warm, which invites conditions that are highly conducive to producing smog. In addition, Marina Del Rey and the entire L.A. Basin frequently experiences an inversion layer that stagnates air and causes pollution emissions to accumulate.
Is air quality in Marina Del Rey cleaner than other areas of Los Angeles County?
Compared to other regions in the surrounding Los Angeles area, according to state officials, Marina Del Rey’s air quality is better than many of its neighboring communities. Marina Del Rey’s 90292 zip code fares better than many other municipalities in the state. The California Environmental Protection Agency (EPA) and the Office of Environmental Health Hazard Assessment (OEHHA) maintain that Marina Del Rey air quality measures lower than more inland communities.7
As noted, Marina Del Rey’s seaside location often protects it from pockets of smog that envelop the greater L.A. Basin, where warm weather and heavy traffic conditions create worse air quality. The use of more fuel-efficient vehicles and Metro services has helped contribute to cleaner air. The recent construction of Exposition Metro Line in Santa Monica has also considerably alleviated vehicle traffic volume since its construction as an extension of service from Culver City.8 This 6.6-mile extension has been used by an estimated 20,000 riders each day, greatly reducing traffic on the nearby US Interstate 10 Freeway and along Pacific Coast Highway. Trains generally run every 12 minutes at most times of the day with service starting at about 4 a.m., and free Metro riding days and reduced pricing during off-peak rush hours contribute to higher ridership, thereby helping to reduce vehicle emissions on surrounding streets and thoroughfares. The availability of low-emission, more fuel-efficient bus lines also help alleviate the city’s traffic conditions, especially during busy summer months with thousands of tourists streaming into the area.
+Article Resources
[1] American Lung Association. (2020). State of the Air Report.
[2] Guerin E. (2018, October 3). Take a deep breath and read about how bad L.A. smog really is. LAist.
[3] Barboza T. (2020, September 10). Los Angeles suffers worst smog in almost 30 years. Los Angeles Times.
[4] Austin P. (2020, September 11). Worst smog in decades creates health threat In Marina Del Rey. Patch.
[5] South Coast Air Quality Management District. (2020). Historical ozone air quality trends.
[6] City of Santa Monica Greenhouse Gas Inventory Report. (2018). 2018 Update.
[7] Abendshein D. (2013, May 5). How bad is Marina Del Rey pollution? Patch.
[8] Hymon S. (2016, February 25). 17 things to know about Expo 2 opening on May 20. Metro.