Rach Gia air quality map
Live air pollution map of Rach Gia
29K people follow this city
Full screen
Contributors category
0
Government
0
Educational
0
Non-profit organization
0
Corporate
0
Individual
0
Anonymous
Station(s) operated by

*IQAir’s AQI data modeled using satellite data. Learn more
Rach Gia does not have air sensor data
Be the first to measure and contribute air quality data to your community.
Understand air pollution and protect yourself
Rach Gia MAP AIR QUALITY ANALYSIS AND STATISTICS
What information can be lifted from the air pollution map for Rach Gia?
When the air quality map for Rach Gia is first opened via the city page, the first thing the viewer will notice is the overall background colour of the map. In this case, the colour is a pale green which indicates “Good” air quality. The various colours and their meanings are explained in the legend at the foot of the screen. The colours shown are pale green which represents good quality air to yellow, orange, red, purple and maroon which is the worst and indicates hazardous air quality.
There are no ground monitoring stations in Rach Gia so all information regarding air quality comes from overhead satellite imagery.
If there are any fires burning near Rach Gia, a symbol will appear on the map showing the location of them. This needs to be considered when looking at the direction of the wind which is shown on the map. This will give forewarning of any possible effects on the air quality of the city. During May 2022, there were no fires burning in the vicinity of Rach Gia.
When the map is viewed in full-screen mode, a table can be seen on the right-hand side of the screen. This table shows the world cities with the worst air quality. It is easy and interesting to compare your home city with others across the globe.
Can any other information be seen on the air quality map for Rach Gia?
On the left-hand side of the screen can be seen four options which can be turned off if required. They show the position of the ground station air monitors for those cities that have them. The position of any wildfires burning in the vicinity, the air quality and the wind direction. This can be useful when looking at the position of the wildfires to see if the ensuing smoke will affect the city. If desired, these can be disabled individually for a clearer view of the air quality map for Rach Gia.
Even though there are no coloured discs directly over Rach Gia, some will be seen on the map near Long Xuyen. They will display the US AQI reading and also the colour of the disc will reflect the air quality. This number is calculated by measuring up to six of the most prolific pollutants in the city atmosphere and can then be used when comparing different cities across the world. It is endorsed by the World Health Organisation (WHO).
For maximum benefit, the air pollution map for Rach Gia should be read in conjunction with the information on the main city page. From that main page, it can be seen that the air quality in the second quarter of 2022 was classified as “Moderate” with a US AQI reading of 51. The main pollutant was PM2.5 with a level of 12.1 µg/m³ (microns per cubic metre). The recommended target figure from the WHO is 5 µg/m³ so Rach Gia exceeds this by 2.4 times.
Following on down the page, some brief advice is offered to advise how best to stay safe when the pollution gets above a certain level. Closing windows and doors to prevent the polluted air from getting into the building and avoiding unnecessary outdoor exercise until conditions improve.
A brief weather forecast can be seen which gives the temperature, humidity, wind speed and air pressure as well as an air quality index (AQI) forecast for the next few days. This can be useful if planning to travel.
Can the areas of high pollution be identified from the air pollution map for Rach Gia?
Because there are no ground-level stations around Rach Gia, it is not possible to detect any area that is more polluted than others. Local residents may know where the industrial areas are and the possibility of higher pollution is much more in those areas. The city centre may have elevated levels at certain times of the day due to excessive traffic during rush hour.
Is the source of the air pollution shown on the pollution map for Rach Gia?
Owing to the lack of ground monitoring stations, the source of the air pollution is not shown. It is suspected that the majority of air pollution comes from the many fishmeal and seafood processing factories as well as from the numerous craft villages surrounding the city. Due to the influence of smoke and dust emitted by factories, the yield of rice and vegetables also decreases.
The main fuel source in the craft villages is solid fuel which mainly consists of black honeycomb charcoal. This is readily available and cheap to buy. It will take a lot of persuading people to change from this fuel to electricity or natural gas.
PM10 and PM2.5 are often mentioned on the air quality map for Rach Gia, but what are they?
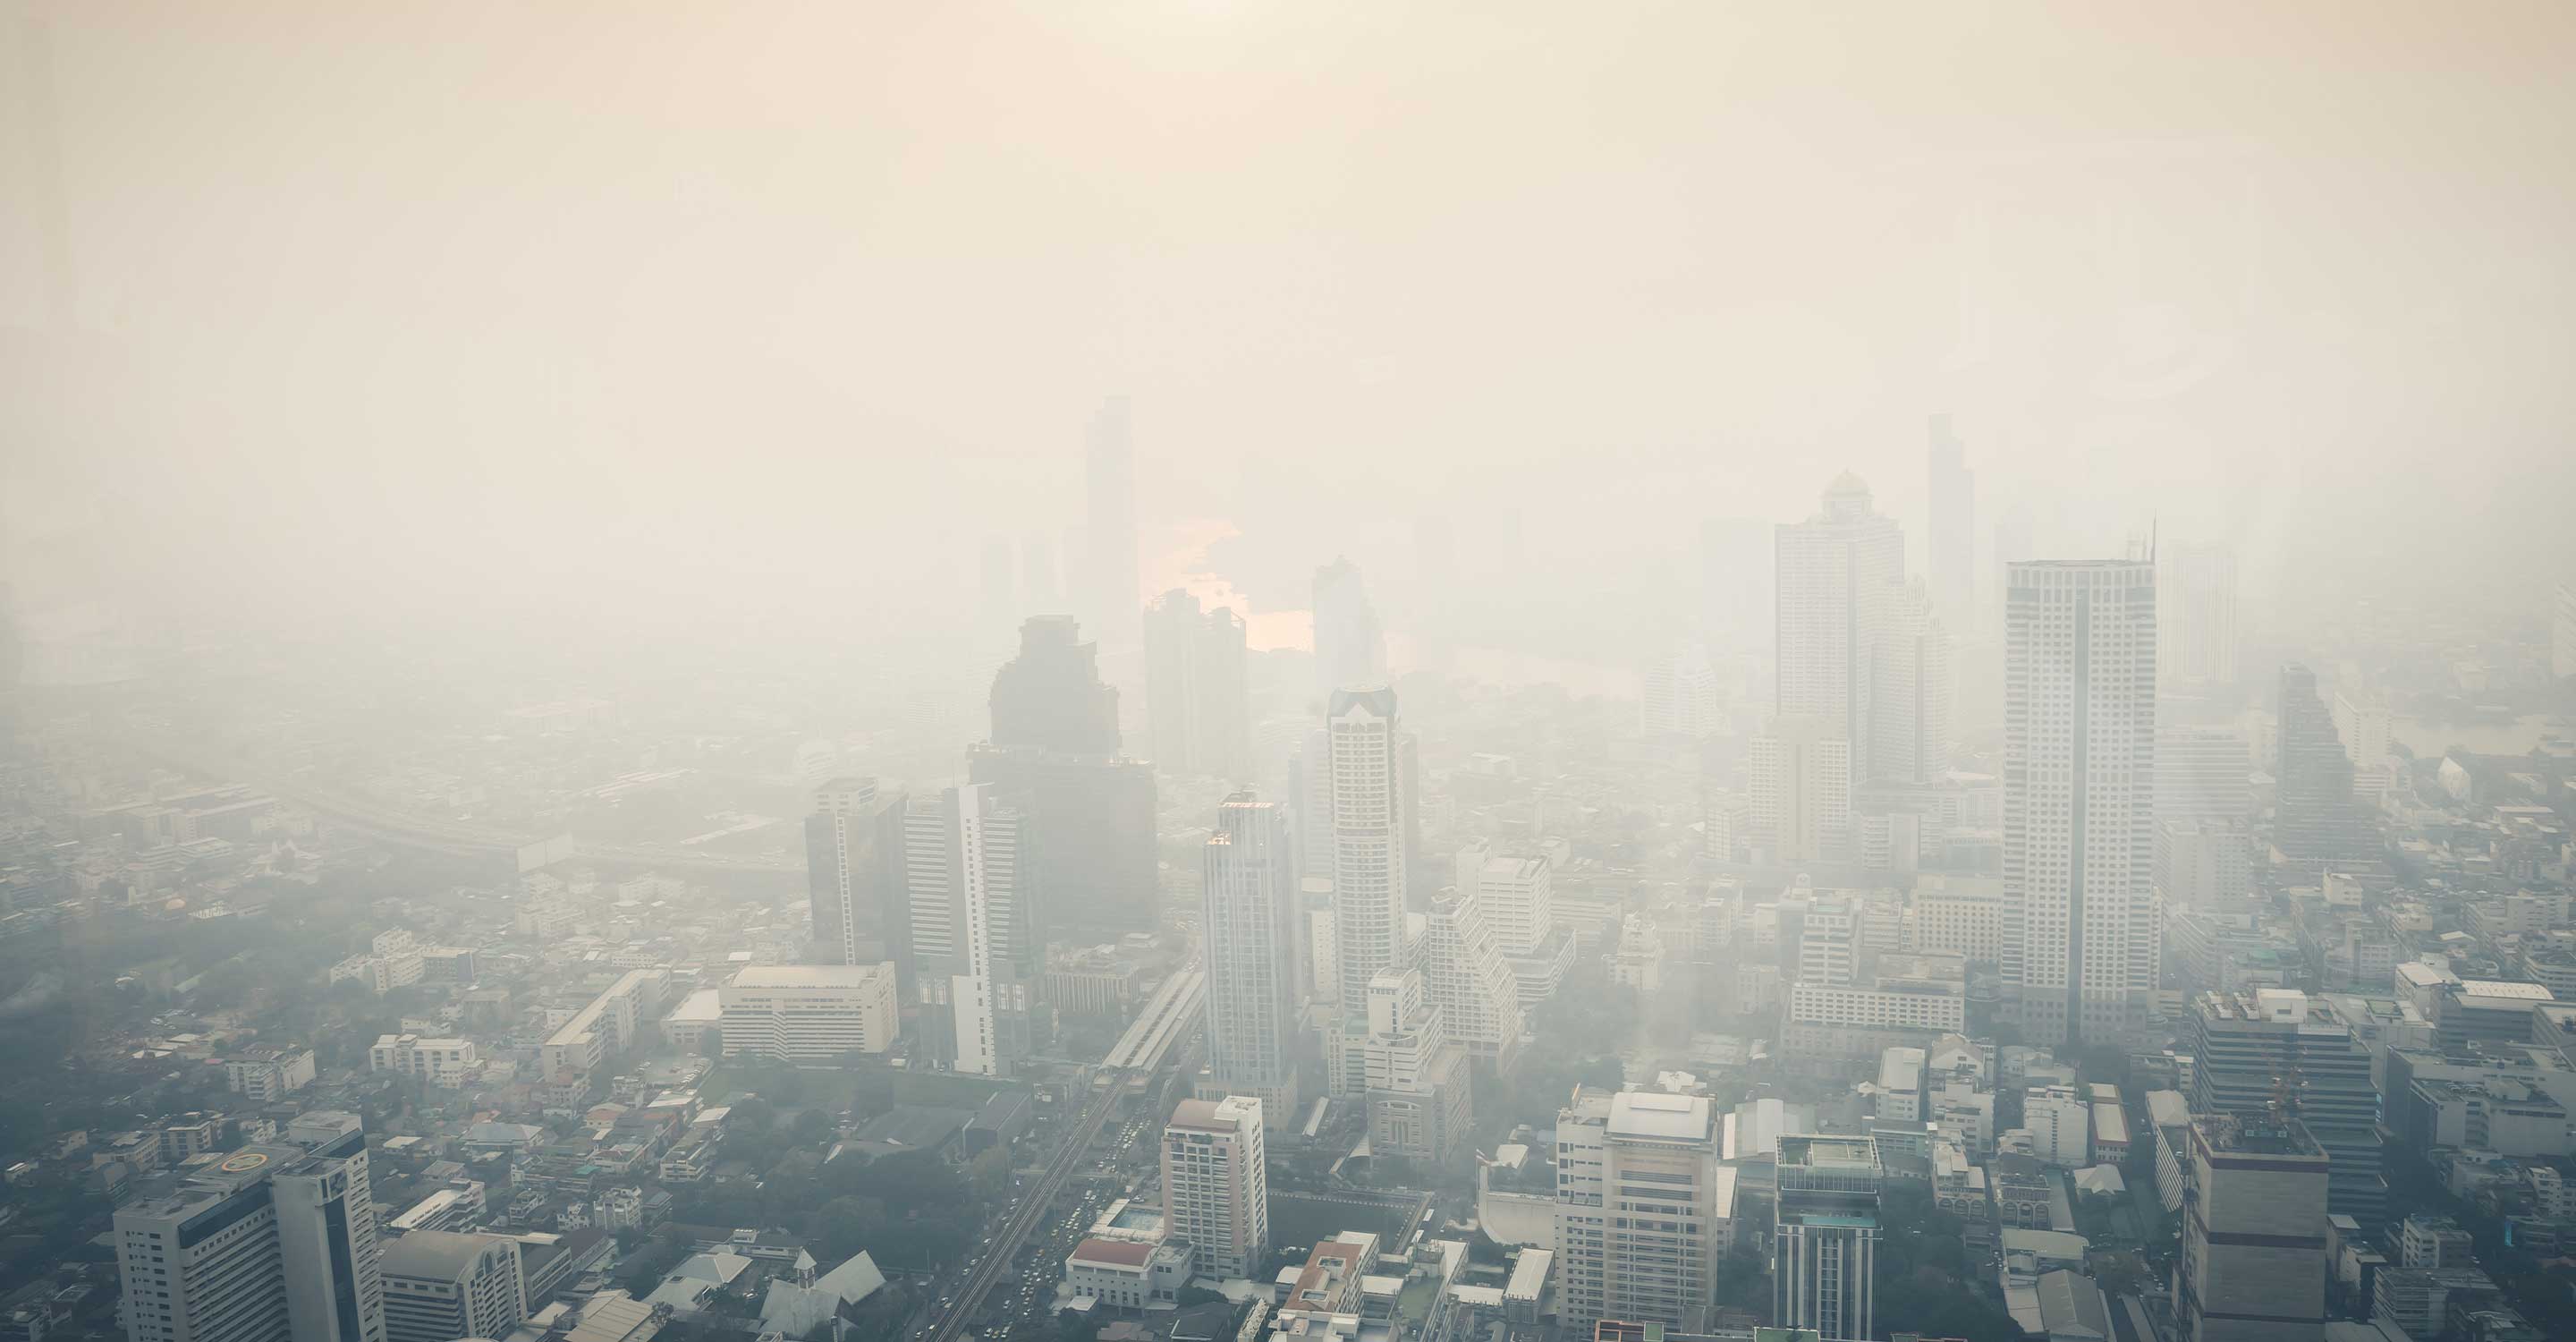
PM2.5 are commonly thought of as being dust particles with a diameter less than or equal to 2.5 microns. This type of dust is formed from substances such as carbon, sulphur, nitrogen and other metal compounds, suspended in the air. As the concentration of PM2.5 in the outdoor air increases, the air will appear hazy and visibility is reduced. Due to the fine dust PM2.5 with the size of 1/30th of a hair, it is considered the most dangerous "killer" in the air because of its ability to penetrate deep into the body, causing a series of respiratory diseases. It travels as far as the alveoli from there it transfers into the bloodstream and throughout the rest of the body.
PM2.5 is the cause of blood poisoning, making blood difficult to clot, affecting the circulatory system, weakening the nervous system that controls the activity of the heart muscle, and causing cardiovascular diseases. Fine dust particles enter the body, reduce lung function, and cause chronic bronchitis, asthma and lung cancer. At the same time, making the condition worse and possibly fatal. It also causes foetal growth retardation. Babies born with low birth weight are more likely to have nervous breakdowns and autism. In addition, PM2.5 also contains many heavy metals capable of causing cancer, or affecting DNA and causing genetic mutations.


