Add
Air quality near E 3rd & St Andrews, North Vancouver
Air quality index (AQI⁺) and PM2.5 air pollution near E 3rd & St Andrews, North Vancouver • 5 Followers • 01:00, Oct 22 Local time
Data sources: AirGradient via OpenAQ (Licensed under CC-BY 4.0)
34
US AQI⁺Good

Main pollutant:
PM2.5
6.2 µg/m³

8°

1 km/h

94 %
Data sources: AirGradient via OpenAQ (Licensed under CC-BY 4.0)
Hourly forecast
E 3rd & St Andrews, North Vancouver air quality index (AQI⁺) forecast


Daily forecast
E 3rd & St Andrews, North Vancouver air quality index (AQI⁺) forecast
| Today | 50 |  | 11° 9° |  6 km/h | 89% |
| Fri | 50 |  | 12° 8° | 7 km/h | 80% |
| Sat | 43 | | 11° 6° | 5 km/h | 72% |
Air pollutants
What is the current air quality near E 3rd & St Andrews?

PM2.5 concentration is currently 1.2 times the World Health Organization annual PM2.5 guideline value.
Health recommendations
 Enjoy outdoor activities |
 Open your windows to bring clean, fresh air indoors Get a monitor |
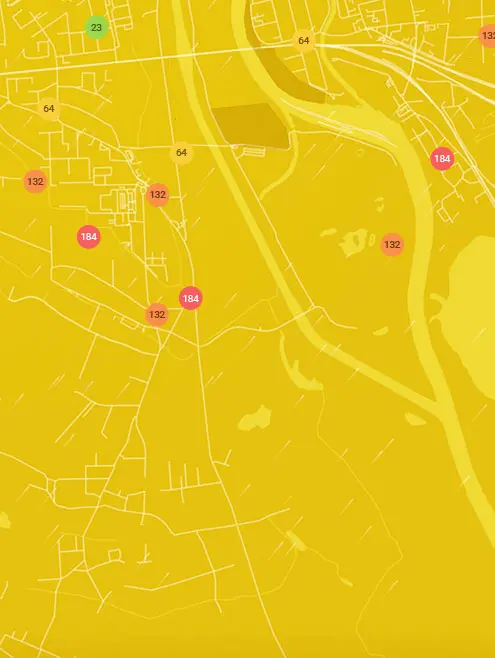
Real-time E 3rd & St Andrews, North Vancouver air pollution map
Pollen
What is the pollen count in E 3rd & St Andrews today?
Index

None
 Tree None | 0% |
 Grass None | 0% |
 Weed None | 0% |
Source:
wetter.comPollen
What is the pollen count in E 3rd & St Andrews today?
Index
None
Tree None | 0% |
Grass None | 0% |
Weed None | 0% |
Source:
wetter.comHistoric air quality near E 3rd & St Andrews
History
Historic air quality graph for E 3rd & St Andrews
Measure your own air quality
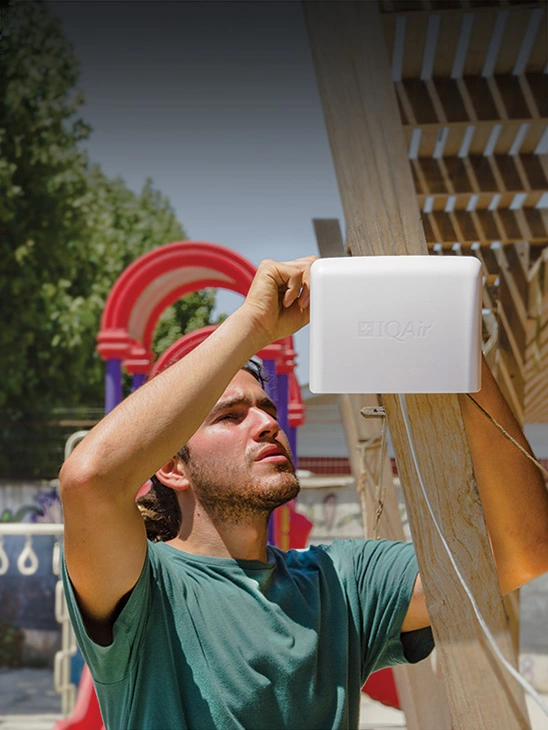
Get a monitor and contribute air quality data in your city.
Most polluted locations near E 3rd & St Andrews, North Vancouver
Worldwide AQI⁺ ranking
Station ranking
Real-time E 3rd & St Andrews AQI⁺ station ranking

City ranking
Real-time Canada AQI⁺ city ranking
Get comprehensive data about air quality in E 3rd & St Andrews, North Vancouver



Download our Air Quality App