WorldArrow icon
Arrow iconHotan

Air quality in Hotan

Air quality index (AQI⁺) and PM2.5 air pollution in Hotan • 10.6K Followers • 12:00, Nov 19 Local time

159

US AQI⁺

Unhealthy

face expression based on aqi value

Main pollutant:

PM2.5

67.5 µg/m³

weather condition icon

5°

wind direction icon

3 km/h

weather humid icon

40 %

Hourly forecast

Hotan air quality index (AQI⁺) forecast

Now

159

Weather icon

5°

IQAir AirVisual Air Quality Map Wind rotating 67 degree

3

km/h

Humidity icon

40%

13:00

151

Weather icon

6°

IQAir AirVisual Air Quality Map Wind rotating 61 degree

5

km/h

Humidity icon

38%

14:00

142

Weather icon

7°

IQAir AirVisual Air Quality Map Wind rotating 64 degree

9

km/h

Humidity icon

35%

15:00

134

Weather icon

8°

IQAir AirVisual Air Quality Map Wind rotating 73 degree

10

km/h

Humidity icon

33%

16:00

125

Weather icon

9°

IQAir AirVisual Air Quality Map Wind rotating 74 degree

10

km/h

Humidity icon

32%

17:00

116

Weather icon

9°

IQAir AirVisual Air Quality Map Wind rotating 78 degree

10

km/h

Humidity icon

31%

18:00

107

Weather icon

9°

IQAir AirVisual Air Quality Map Wind rotating 80 degree

12

km/h

Humidity icon

30%

19:00

97

Weather icon

9°

IQAir AirVisual Air Quality Map Wind rotating 81 degree

12

km/h

Humidity icon

31%

20:00

87

Weather icon

7°

IQAir AirVisual Air Quality Map Wind rotating 86 degree

12

km/h

Humidity icon

34%

21:00

78

Weather icon

6°

IQAir AirVisual Air Quality Map Wind rotating 103 degree

12

km/h

Humidity icon

35%

22:00

69

Weather icon

6°

IQAir AirVisual Air Quality Map Wind rotating 121 degree

10

km/h

Humidity icon

37%

23:00

60

Weather icon

5°

IQAir AirVisual Air Quality Map Wind rotating 127 degree

8

km/h

Humidity icon

38%

Fri

00:00

50

Weather icon

5°

IQAir AirVisual Air Quality Map Wind rotating 102 degree

6

km/h

Humidity icon

39%

01:00

49

Weather icon

4°

IQAir AirVisual Air Quality Map Wind rotating 83 degree

8

km/h

Humidity icon

39%

02:00

48

Weather icon

4°

IQAir AirVisual Air Quality Map Wind rotating 78 degree

9

km/h

Humidity icon

40%

03:00

49

Weather icon

3°

IQAir AirVisual Air Quality Map Wind rotating 70 degree

7

km/h

Humidity icon

40%

04:00

50

Weather icon

2°

IQAir AirVisual Air Quality Map Wind rotating 78 degree

5

km/h

Humidity icon

40%

05:00

51

Weather icon

2°

IQAir AirVisual Air Quality Map Wind rotating 77 degree

2

km/h

Humidity icon

42%

06:00

49

Weather icon

2°

IQAir AirVisual Air Quality Map Wind rotating 55 degree

1

km/h

Humidity icon

42%

07:00

48

Weather icon

1°

IQAir AirVisual Air Quality Map Wind rotating 12 degree

2

km/h

Humidity icon

43%

08:00

47

Weather icon

1°

IQAir AirVisual Air Quality Map Wind rotating 32 degree

3

km/h

Humidity icon

43%

09:00

46

Weather icon

1°

IQAir AirVisual Air Quality Map Wind rotating 67 degree

2

km/h

Humidity icon

44%

10:00

45

Weather icon

2°

IQAir AirVisual Air Quality Map Wind rotating 36 degree

1

km/h

Humidity icon

43%

11:00

44

Weather icon

4°

IQAir AirVisual Air Quality Map Wind rotating 10 degree

1

km/h

Humidity icon

37%

12:00

43

Weather icon

5°

IQAir AirVisual Air Quality Map Wind rotating 11 degree

3

km/h

Humidity icon

34%

13:00

42

Weather icon

6°

IQAir AirVisual Air Quality Map Wind rotating 29 degree

4

km/h

Humidity icon

32%

14:00

42

Weather icon

7°

IQAir AirVisual Air Quality Map Wind rotating 55 degree

5

km/h

Humidity icon

29%

15:00

41

Weather icon

8°

IQAir AirVisual Air Quality Map Wind rotating 64 degree

6

km/h

Humidity icon

28%

16:00

40

Weather icon

8°

IQAir AirVisual Air Quality Map Wind rotating 69 degree

7

km/h

Humidity icon

27%

17:00

40

Weather icon

9°

IQAir AirVisual Air Quality Map Wind rotating 96 degree

7

km/h

Humidity icon

26%

18:00

36

Weather icon

9°

IQAir AirVisual Air Quality Map Wind rotating 95 degree

8

km/h

Humidity icon

26%

19:00

32

Weather icon

8°

IQAir AirVisual Air Quality Map Wind rotating 93 degree

8

km/h

Humidity icon

27%

20:00

29

Weather icon

7°

IQAir AirVisual Air Quality Map Wind rotating 88 degree

10

km/h

Humidity icon

30%

21:00

30

Weather icon

6°

IQAir AirVisual Air Quality Map Wind rotating 102 degree

11

km/h

Humidity icon

31%

22:00

31

Weather icon

6°

IQAir AirVisual Air Quality Map Wind rotating 118 degree

10

km/h

Humidity icon

33%

23:00

33

Weather icon

5°

IQAir AirVisual Air Quality Map Wind rotating 132 degree

10

km/h

Humidity icon

34%

Sat

00:00

33

Weather icon

5°

IQAir AirVisual Air Quality Map Wind rotating 132 degree

8

km/h

Humidity icon

35%

01:00

33

Weather icon

4°

IQAir AirVisual Air Quality Map Wind rotating 129 degree

7

km/h

Humidity icon

36%

02:00

33

Weather icon

4°

IQAir AirVisual Air Quality Map Wind rotating 122 degree

6

km/h

Humidity icon

36%

03:00

37

Weather icon

3°

IQAir AirVisual Air Quality Map Wind rotating 101 degree

5

km/h

Humidity icon

37%

04:00

42

Weather icon

3°

IQAir AirVisual Air Quality Map Wind rotating 90 degree

5

km/h

Humidity icon

38%

05:00

47

Weather icon

3°

IQAir AirVisual Air Quality Map Wind rotating 94 degree

6

km/h

Humidity icon

39%

06:00

48

Weather icon

3°

IQAir AirVisual Air Quality Map Wind rotating 104 degree

6

km/h

Humidity icon

39%

07:00

49

Weather icon

3°

IQAir AirVisual Air Quality Map Wind rotating 113 degree

5

km/h

Humidity icon

39%

08:00

51

Weather icon

2°

IQAir AirVisual Air Quality Map Wind rotating 112 degree

4

km/h

Humidity icon

41%

09:00

51

Weather icon

2°

IQAir AirVisual Air Quality Map Wind rotating 90 degree

5

km/h

Humidity icon

41%

10:00

52

Weather icon

3°

IQAir AirVisual Air Quality Map Wind rotating 96 degree

7

km/h

Humidity icon

39%

11:00

53

Weather icon

5°

IQAir AirVisual Air Quality Map Wind rotating 89 degree

8

km/h

Humidity icon

35%

12:00

52

Weather icon

6°

IQAir AirVisual Air Quality Map Wind rotating 75 degree

8

km/h

Humidity icon

31%

13:00

51

Weather icon

7°

IQAir AirVisual Air Quality Map Wind rotating 58 degree

8

km/h

Humidity icon

29%

14:00

51

Weather icon

8°

IQAir AirVisual Air Quality Map Wind rotating 58 degree

7

km/h

Humidity icon

27%

15:00

50

Weather icon

9°

IQAir AirVisual Air Quality Map Wind rotating 64 degree

6

km/h

Humidity icon

25%

16:00

50

Weather icon

10°

IQAir AirVisual Air Quality Map Wind rotating 72 degree

7

km/h

Humidity icon

24%

17:00

50

Weather icon

10°

IQAir AirVisual Air Quality Map Wind rotating 76 degree

7

km/h

Humidity icon

23%

18:00

49

Weather icon

10°

IQAir AirVisual Air Quality Map Wind rotating 80 degree

8

km/h

Humidity icon

23%

19:00

49

Weather icon

9°

IQAir AirVisual Air Quality Map Wind rotating 72 degree

7

km/h

Humidity icon

25%

20:00

49

Weather icon

8°

IQAir AirVisual Air Quality Map Wind rotating 73 degree

9

km/h

Humidity icon

27%

21:00

50

Weather icon

7°

IQAir AirVisual Air Quality Map Wind rotating 91 degree

8

km/h

Humidity icon

29%

22:00

51

Weather icon

7°

IQAir AirVisual Air Quality Map Wind rotating 116 degree

6

km/h

Humidity icon

30%

23:00

53

Weather icon

6°

IQAir AirVisual Air Quality Map Wind rotating 150 degree

3

km/h

Humidity icon

32%

Sun

00:00

50

Weather icon

6°

IQAir AirVisual Air Quality Map Wind rotating 253 degree

1

km/h

Humidity icon

33%

01:00

47

Weather icon

5°

IQAir AirVisual Air Quality Map Wind rotating 319 degree

4

km/h

Humidity icon

33%

02:00

44

Weather icon

5°

IQAir AirVisual Air Quality Map Wind rotating 340 degree

3

km/h

Humidity icon

34%

03:00

46

Weather icon

5°

IQAir AirVisual Air Quality Map Wind rotating 339 degree

3

km/h

Humidity icon

34%

04:00

49

Weather icon

4°

IQAir AirVisual Air Quality Map Wind rotating 355 degree

4

km/h

Humidity icon

34%

05:00

52

Weather icon

4°

IQAir AirVisual Air Quality Map Wind rotating 297 degree

4

km/h

Humidity icon

34%

06:00

51

Weather icon

3°

IQAir AirVisual Air Quality Map Wind rotating 275 degree

4

km/h

Humidity icon

35%

07:00

51

Weather icon

3°

IQAir AirVisual Air Quality Map Wind rotating 269 degree

5

km/h

Humidity icon

36%

08:00

51

Weather icon

3°

IQAir AirVisual Air Quality Map Wind rotating 277 degree

4

km/h

Humidity icon

37%

09:00

46

Weather icon

3°

IQAir AirVisual Air Quality Map Wind rotating 285 degree

4

km/h

Humidity icon

38%

10:00

42

Weather icon

3°

IQAir AirVisual Air Quality Map Wind rotating 275 degree

3

km/h

Humidity icon

37%

11:00

38

Weather icon

6°

IQAir AirVisual Air Quality Map Wind rotating 275 degree

2

km/h

Humidity icon

31%

Daily forecast

|

Hotan air quality index (AQI⁺) forecast

Air pollutants

What is the current air quality in Hotan?

IQAir exclamation icon

PM2.5 concentration is currently 13.5 times the World Health Organization annual PM2.5 guideline value.
Health recommendations

Allergy forecast

Today

Very Low

天气条件极不易诱发过敏。

Friday

Very Low

Saturday

Very Low
Pollen forecast in Hotan

Health recommendations

Allergy forecast

Today

Very Low

天气条件极不易诱发过敏。

Friday

Very Low

Saturday

Very Low
Pollen forecast in Hotan

Most polluted locations near Hotan

Worldwide AQI⁺ rankingArrow icon

Station ranking

Real-time AQI⁺ station ranking for stations in Hotan

#StationsAQI⁺ US
1
The national flag of China

Diquhuanbaoju

166

2
The national flag of China

Shihuanbaoju

153

City ranking

Real-time China AQI⁺ city ranking

#CitiesAQI⁺ US
1
The national flag of China

Kashgar, Xinjiang

154

2
The national flag of China

Jixi, Heilongjiang

147

3
The national flag of China

Qitaihe, Heilongjiang

128

4
The national flag of China

Urumqi, Xinjiang

127

5
The national flag of China

Meishan, Sichuan

117

6
The national flag of China

Qujing, Yunnan

113

7
The national flag of China

Kizilsu Kirghiz Autonomous Prefecture, Xinjiang

110

8
The national flag of China

Ziyang, Sichuan

105

9
The national flag of China

Chengdu, Sichuan

102

10
The national flag of China

Liangshan, Sichuan

102

History

Historic air quality graph for Hotan

159 AQI⁺ US
Unhealthy
12:00–13:00 Nov 19 Local time
AQI⁺ US

History

Historic air quality graph for Hotan

159 AQI⁺ US
Unhealthy
12:00–13:00 Nov 19 Local time
AQI⁺ US

Most polluted locations near Hotan

Worldwide AQI⁺ rankingArrow icon

Station ranking

Real-time AQI⁺ station ranking for stations in Hotan

#StationsAQI⁺ US
1
The national flag of China

Diquhuanbaoju

166

2
The national flag of China

Shihuanbaoju

153

City ranking

Real-time China AQI⁺ city ranking

#CitiesAQI⁺ US
1
The national flag of China

Kashgar, Xinjiang

154

2
The national flag of China

Jixi, Heilongjiang

147

3
The national flag of China

Qitaihe, Heilongjiang

128

4
The national flag of China

Urumqi, Xinjiang

127

5
The national flag of China

Meishan, Sichuan

117

6
The national flag of China

Qujing, Yunnan

113

7
The national flag of China

Kizilsu Kirghiz Autonomous Prefecture, Xinjiang

110

8
The national flag of China

Ziyang, Sichuan

105

9
The national flag of China

Chengdu, Sichuan

102

10
The national flag of China

Liangshan, Sichuan

102

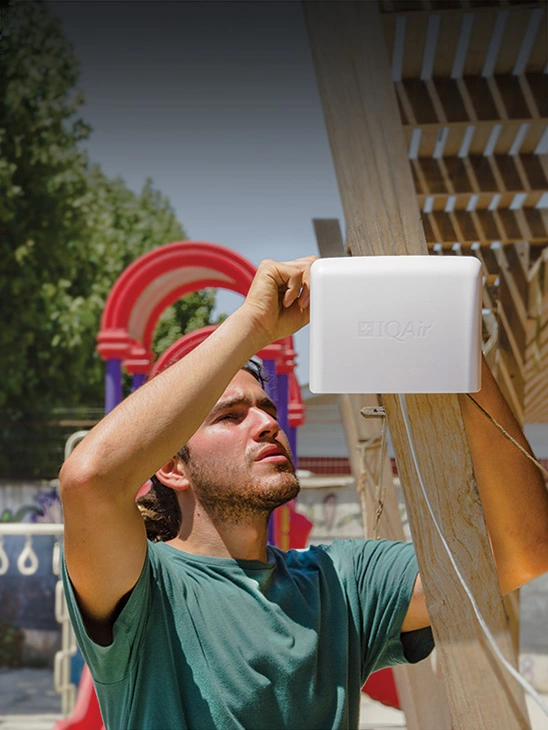
Measure your own air quality

Get a monitor and contribute air quality data in your city.

What is the current air quality in Hotan?

The current air quality in Hotan is considered unhealthy. Everyone may begin to experience adverse health effects, with sensitive groups at greater risk.

Is the air badly polluted in Hotan?

Hotan is a city located in the far western region of China. It is home to over 408 thousand people as per a census conducted in 2018, and will have thus grown since then. It is also a city that has seen some of the worst air pollution levels in recent times, coming in with some catastrophic readings of pollution levels that placed it within the highest position of all cities worldwide.

In the month of April of 2021, Hotan was seen with a US AQI reading of 122, a number that would place it within the ‘unhealthy for sensitive groups’ bracket for that particular point in time. As the name implies, many people in the city would be at great risk for adverse health effects occurring, with more vulnerable groups such as those with poor health or compromised immune systems being even more at risk, along with children, the elderly and pregnant women.

This however pales in comparison to its reading in the year prior, when the city came in with a PM2.5 reading of 110.2 μg/m³ as its yearly average, placing it in 1st place out of all cities ranked in China, as well as all 1st place out of all cities ranked worldwide in 2020. This is indicative that the air quality in Hotan would shorten the lifespan of its citizens by a significant amount, with the PM2.5 count of 110.2 μg/m³ placing it in the higher end of the ‘unhealthy’ ratings bracket, which requires a PM2.5 reading of 55.5 to 150.4 μg/m³ to be classified as such.

PM2.5 refers to particulate matter that is 2.5 micrometers or less in diameter, being comprised of many different types of coagulated chemicals or other such materials. Due to its immensely small size and the danger it presents to human health, it is used as one of the major components in calculating the overall US AQI, or United States Air Quality Index, a number that is a composite of a number of different pollutants including PM2.5, PM10 and various other compounds that will be discussed in more detail later.

In regards to the extremely poor air quality seen in Hotan, much of it is heavily linked to the large amounts of both fine (PM2.5) and coarse (PM10) particles that are blown up into the air from the frequent sandstorms, made worse by the addition of various industrial and anthropogenic activities that also cause large amounts of pollution to permeate the atmosphere.

What causes such high pollution levels in Hotan?

Hotan has many pollutive issues similar to other cities in China, with an unprecedented increase in industry taking its toll on the quality of the air. With many industrial sites and factories rapidly opening up, there is a subsequent increase in the amount of chemical contaminants and dangerous particulate matter appearing in the air.

Vehicles would also play a large role in pollution levels, with many of them being aged or out of date, as well as running on unclean fuel sources due to lack of stringent regulations. Freight vehicles such as lorries or trucks that move in and out of the city for industrial purposes also add to this element, with even the tires of such vehicles giving off thousands of tons of microscopic rubber particles that can build up in the air.

However, for Hotan, the main problem appears to be coming from the fervent dust storms that are so frequent in the region, with April through to June being the official ‘season’ for dust clouds, although of note is that they can strike at any time of the year without warning. Hotan finds itself near the Taklamakan desert, and with many cities nearby in Xinjiang, these sandstorms can appear spontaneously and cause visibility to drop to less than 100 meters in very short spans of time.

These huge clouds of both fine and coarse particles make the air extremely polluted and dangerous to breathe, with these materials having many damaging effects to both the lungs and other systems in the body. Scarring of the lung tissue can occur which can lead to many ill health effects, as well as the tiniest particles having the ability to even enter the bloodstream and wreak further havoc on the various systems throughout the body.

When is the air pollution level at its highest in Hotan?

Observing the data collected over the course of 2020, there were some months with the most extreme levels of PM2.5, as would be expected from a city that took first place out of every city ranked worldwide. To quote some of these figures, the months of February through to April were when the pollution levels hit their absolute peaks, with PM2.5 numbers of 124.7 μg/m³, 264.4 μg/m³ and 176.4 μg/m³ coming in respectively.

This made March the most polluted month of the year, with a PM2.5 reading that placed it in the ‘hazardous’ air quality bracket, a rarely seen rating that indicates that the air would be directly linked to many early deaths and extreme health issues as a result. To fall into the hazardous bracket, a reading of any PM2.5 number greater than 250.4 μg/m³ is required, the highest ranking of air pollution available.

When is the air quality at its least polluted in Hotan?

Whilst every month had extremely high readings of air pollution, the months of January, July, August, November and December all came in with slightly more appreciable readings, with PM2.5 numbers of 93.7 μg/m³, 85.2 μg/m³, 84 μg/m³, 59.7 μg/m³ and 51.9 μg/m³ all being present respectively, making December the cleanest month of the year and the only month to make it into the ‘moderate’ pollution bracket, eking its way in by just a few units, albeit on the absolute high end of this ratings bracket.

What are the different types of pollution that can be found in Hotan’s air?

With much of its pollution stemming from natural occurrences and compounded further by anthropogenic activity, Hotan would have large amounts of the aforementioned coarse and fine particles present in the air, as well as a variety of different chemical pollutants. Finely ground silica, sand, gravel and various other types of dust would be present, some of which (such as silica and black carbon) having carcinogenic properties when inhaled.

Other pollutants released from various industrial or vehicular sources would be ones such as ozone (O3), nitrogen dioxide (NO2) and sulfur dioxide (SO2), as well as volatile organic compounds (VOCs), dioxins, furans and even heavy metals such as mercury, lead and cadmium.

Where is the cleanest air quality in Hotan?