WorldArrow icon
Arrow iconUrumqi

Air quality in Urumqi

Air quality index (AQI⁺) and PM2.5 air pollution in Urumqi • 54.3K Followers • 12:00, Nov 19 Local time

127

US AQI⁺

Unhealthy for sensitive groups

face expression based on aqi value

Main pollutant:

PM2.5

46 µg/m³

weather condition icon

3°

wind direction icon

5 km/h

weather humid icon

36 %

Hourly forecast

Urumqi air quality index (AQI⁺) forecast

Now

127

Weather icon

3°

IQAir AirVisual Air Quality Map Wind rotating 61 degree

5

km/h

Humidity icon

36%

13:00

122

Weather icon

4°

IQAir AirVisual Air Quality Map Wind rotating 40 degree

6

km/h

Humidity icon

32%

14:00

118

Weather icon

4°

IQAir AirVisual Air Quality Map Wind rotating 31 degree

7

km/h

Humidity icon

30%

15:00

112

Weather icon

5°

IQAir AirVisual Air Quality Map Wind rotating 17 degree

8

km/h

Humidity icon

29%

16:00

107

Weather icon

5°

IQAir AirVisual Air Quality Map Wind rotating 12 degree

8

km/h

Humidity icon

29%

17:00

101

Weather icon

5°

IQAir AirVisual Air Quality Map Wind rotating 2 degree

6

km/h

Humidity icon

29%

18:00

94

Weather icon

4°

IQAir AirVisual Air Quality Map Wind rotating 6 degree

4

km/h

Humidity icon

31%

19:00

87

Weather icon

3°

IQAir AirVisual Air Quality Map Wind rotating 78 degree

2

km/h

Humidity icon

34%

20:00

80

Weather icon

3°

IQAir AirVisual Air Quality Map Wind rotating 118 degree

3

km/h

Humidity icon

36%

21:00

74

Weather icon

3°

IQAir AirVisual Air Quality Map Wind rotating 116 degree

4

km/h

Humidity icon

38%

22:00

68

Weather icon

3°

IQAir AirVisual Air Quality Map Wind rotating 109 degree

6

km/h

Humidity icon

38%

23:00

62

Weather icon

3°

IQAir AirVisual Air Quality Map Wind rotating 104 degree

4

km/h

Humidity icon

39%

Fri

00:00

57

Weather icon

2°

IQAir AirVisual Air Quality Map Wind rotating 117 degree

2

km/h

Humidity icon

40%

01:00

59

Weather icon

2°

IQAir AirVisual Air Quality Map Wind rotating 50 degree

1

km/h

Humidity icon

40%

02:00

61

Weather icon

2°

IQAir AirVisual Air Quality Map Wind rotating 45 degree

1

km/h

Humidity icon

41%

03:00

60

Weather icon

2°

IQAir AirVisual Air Quality Map Wind rotating 133 degree

1

km/h

Humidity icon

41%

04:00

59

Weather icon

2°

IQAir AirVisual Air Quality Map Wind rotating 180 degree

1

km/h

Humidity icon

41%

05:00

59

Weather icon

1°

IQAir AirVisual Air Quality Map Wind rotating 9 degree

0

km/h

Humidity icon

42%

06:00

57

Weather icon

1°

IQAir AirVisual Air Quality Map Wind rotating 342 degree

1

km/h

Humidity icon

42%

07:00

56

Weather icon

1°

IQAir AirVisual Air Quality Map Wind rotating 215 degree

1

km/h

Humidity icon

42%

08:00

55

Weather icon

1°

IQAir AirVisual Air Quality Map Wind rotating 213 degree

1

km/h

Humidity icon

42%

09:00

54

Weather icon

1°

IQAir AirVisual Air Quality Map Wind rotating 90 degree

0

km/h

Humidity icon

42%

10:00

53

Weather icon

1°

IQAir AirVisual Air Quality Map Wind rotating 58 degree

1

km/h

Humidity icon

41%

11:00

53

Weather icon

2°

IQAir AirVisual Air Quality Map Wind rotating 17 degree

1

km/h

Humidity icon

39%

12:00

55

Weather icon

3°

IQAir AirVisual Air Quality Map Wind rotating 38 degree

2

km/h

Humidity icon

36%

13:00

58

Weather icon

4°

IQAir AirVisual Air Quality Map Wind rotating 359 degree

4

km/h

Humidity icon

33%

14:00

61

Weather icon

4°

IQAir AirVisual Air Quality Map Wind rotating 352 degree

7

km/h

Humidity icon

32%

15:00

61

Weather icon

4°

IQAir AirVisual Air Quality Map Wind rotating 348 degree

8

km/h

Humidity icon

31%

16:00

62

Weather icon

4°

IQAir AirVisual Air Quality Map Wind rotating 359 degree

7

km/h

Humidity icon

30%

17:00

63

Weather icon

4°

IQAir AirVisual Air Quality Map Wind rotating 5 degree

5

km/h

Humidity icon

30%

18:00

62

Weather icon

4°

IQAir AirVisual Air Quality Map Wind rotating 334 degree

7

km/h

Humidity icon

31%

19:00

61

Weather icon

3°

IQAir AirVisual Air Quality Map Wind rotating 57 degree

8

km/h

Humidity icon

33%

20:00

60

Weather icon

3°

IQAir AirVisual Air Quality Map Wind rotating 70 degree

1

km/h

Humidity icon

34%

21:00

60

Weather icon

3°

IQAir AirVisual Air Quality Map Wind rotating 114 degree

3

km/h

Humidity icon

36%

22:00

61

Weather icon

3°

IQAir AirVisual Air Quality Map Wind rotating 57 degree

2

km/h

Humidity icon

37%

23:00

62

Weather icon

3°

IQAir AirVisual Air Quality Map Wind rotating 107 degree

2

km/h

Humidity icon

38%

Sat

00:00

60

Weather icon

3°

IQAir AirVisual Air Quality Map Wind rotating 147 degree

6

km/h

Humidity icon

39%

01:00

59

Weather icon

3°

IQAir AirVisual Air Quality Map Wind rotating 189 degree

2

km/h

Humidity icon

39%

02:00

58

Weather icon

3°

IQAir AirVisual Air Quality Map Wind rotating 110 degree

2

km/h

Humidity icon

39%

03:00

62

Weather icon

3°

IQAir AirVisual Air Quality Map Wind rotating 36 degree

1

km/h

Humidity icon

40%

04:00

66

Weather icon

2°

IQAir AirVisual Air Quality Map Wind rotating 72 degree

2

km/h

Humidity icon

39%

05:00

70

Weather icon

2°

IQAir AirVisual Air Quality Map Wind rotating 151 degree

3

km/h

Humidity icon

39%

06:00

70

Weather icon

2°

IQAir AirVisual Air Quality Map Wind rotating 172 degree

2

km/h

Humidity icon

39%

07:00

71

Weather icon

2°

IQAir AirVisual Air Quality Map Wind rotating 163 degree

3

km/h

Humidity icon

39%

08:00

72

Weather icon

3°

IQAir AirVisual Air Quality Map Wind rotating 159 degree

4

km/h

Humidity icon

39%

09:00

72

Weather icon

3°

IQAir AirVisual Air Quality Map Wind rotating 178 degree

3

km/h

Humidity icon

38%

10:00

72

Weather icon

3°

IQAir AirVisual Air Quality Map Wind rotating 161 degree

4

km/h

Humidity icon

37%

11:00

72

Weather icon

4°

IQAir AirVisual Air Quality Map Wind rotating 168 degree

4

km/h

Humidity icon

34%

12:00

71

Weather icon

6°

IQAir AirVisual Air Quality Map Wind rotating 269 degree

1

km/h

Humidity icon

31%

13:00

70

Weather icon

6°

IQAir AirVisual Air Quality Map Wind rotating 359 degree

4

km/h

Humidity icon

30%

14:00

70

Weather icon

6°

IQAir AirVisual Air Quality Map Wind rotating 13 degree

6

km/h

Humidity icon

29%

15:00

71

Weather icon

6°

IQAir AirVisual Air Quality Map Wind rotating 9 degree

5

km/h

Humidity icon

29%

16:00

73

Weather icon

7°

IQAir AirVisual Air Quality Map Wind rotating 19 degree

5

km/h

Humidity icon

28%

17:00

75

Weather icon

7°

IQAir AirVisual Air Quality Map Wind rotating 16 degree

5

km/h

Humidity icon

28%

18:00

73

Weather icon

6°

IQAir AirVisual Air Quality Map Wind rotating 25 degree

3

km/h

Humidity icon

29%

19:00

72

Weather icon

5°

IQAir AirVisual Air Quality Map Wind rotating 17 degree

4

km/h

Humidity icon

31%

20:00

71

Weather icon

5°

IQAir AirVisual Air Quality Map Wind rotating 78 degree

4

km/h

Humidity icon

32%

21:00

71

Weather icon

5°

IQAir AirVisual Air Quality Map Wind rotating 176 degree

3

km/h

Humidity icon

31%

22:00

72

Weather icon

5°

IQAir AirVisual Air Quality Map Wind rotating 117 degree

0

km/h

Humidity icon

31%

23:00

73

Weather icon

5°

IQAir AirVisual Air Quality Map Wind rotating 51 degree

3

km/h

Humidity icon

31%

Sun

00:00

73

Weather icon

5°

IQAir AirVisual Air Quality Map Wind rotating 26 degree

1

km/h

Humidity icon

32%

01:00

74

Weather icon

4°

IQAir AirVisual Air Quality Map Wind rotating 14 degree

3

km/h

Humidity icon

32%

02:00

75

Weather icon

4°

IQAir AirVisual Air Quality Map Wind rotating 9 degree

3

km/h

Humidity icon

34%

03:00

78

Weather icon

4°

IQAir AirVisual Air Quality Map Wind rotating 322 degree

1

km/h

Humidity icon

34%

04:00

82

Weather icon

4°

IQAir AirVisual Air Quality Map Wind rotating 340 degree

3

km/h

Humidity icon

34%

05:00

86

Weather icon

3°

IQAir AirVisual Air Quality Map Wind rotating 39 degree

2

km/h

Humidity icon

35%

06:00

83

Weather icon

3°

IQAir AirVisual Air Quality Map Wind rotating 1 degree

2

km/h

Humidity icon

36%

07:00

81

Weather icon

3°

IQAir AirVisual Air Quality Map Wind rotating 125 degree

2

km/h

Humidity icon

36%

08:00

79

Weather icon

3°

IQAir AirVisual Air Quality Map Wind rotating 178 degree

3

km/h

Humidity icon

35%

09:00

76

Weather icon

3°

IQAir AirVisual Air Quality Map Wind rotating 142 degree

2

km/h

Humidity icon

35%

10:00

73

Weather icon

4°

IQAir AirVisual Air Quality Map Wind rotating 100 degree

2

km/h

Humidity icon

35%

11:00

71

Weather icon

5°

IQAir AirVisual Air Quality Map Wind rotating 58 degree

2

km/h

Humidity icon

33%

Daily forecast

|

Urumqi air quality index (AQI⁺) forecast

Air pollutants

What is the current air quality in Urumqi?

IQAir exclamation icon

PM2.5 concentration is currently 9.2 times the World Health Organization annual PM2.5 guideline value.
Health recommendations

Allergy forecast

Today

Very Low

天气条件极不易诱发过敏。

Friday

Very Low

Saturday

Very Low
Pollen forecast in Urumqi

Health recommendations

Allergy forecast

Today

Very Low

天气条件极不易诱发过敏。

Friday

Very Low

Saturday

Very Low
Pollen forecast in Urumqi

Most polluted locations near Urumqi

Worldwide AQI⁺ rankingArrow icon

Station ranking

Real-time AQI⁺ station ranking for stations in Urumqi

#StationsAQI⁺ US
1
The national flag of China

Tieluju

158

2
The national flag of China

Hongguangshanpianqu

139

3
The national flag of China

Sanshiyizhongxue

127

4
The national flag of China

Shoufeisuo

127

5
The national flag of China

Dalvgu

94

6
The national flag of China

Xinshidawenquanxiaoqu

84

7
The national flag of China

Dabanchengquhuanbaoju

68

8
The national flag of China

Peixunjidi

30

City ranking

Real-time China AQI⁺ city ranking

#CitiesAQI⁺ US
1
The national flag of China

Kashgar, Xinjiang

154

2
The national flag of China

Jixi, Heilongjiang

147

3
The national flag of China

Qitaihe, Heilongjiang

128

4
The national flag of China

Urumqi, Xinjiang

127

5
The national flag of China

Meishan, Sichuan

117

6
The national flag of China

Qujing, Yunnan

113

7
The national flag of China

Kizilsu Kirghiz Autonomous Prefecture, Xinjiang

110

8
The national flag of China

Ziyang, Sichuan

105

9
The national flag of China

Chengdu, Sichuan

102

10
The national flag of China

Liangshan, Sichuan

102

History

Historic air quality graph for Urumqi

127 AQI⁺ US
Unhealthy for sensitive groups
12:00–13:00 Nov 19 Local time
AQI⁺ US

History

Historic air quality graph for Urumqi

127 AQI⁺ US
Unhealthy for sensitive groups
12:00–13:00 Nov 19 Local time
AQI⁺ US

Most polluted locations near Urumqi

Worldwide AQI⁺ rankingArrow icon

Station ranking

Real-time AQI⁺ station ranking for stations in Urumqi

#StationsAQI⁺ US
1
The national flag of China

Tieluju

158

2
The national flag of China

Hongguangshanpianqu

139

3
The national flag of China

Sanshiyizhongxue

127

4
The national flag of China

Shoufeisuo

127

5
The national flag of China

Dalvgu

94

6
The national flag of China

Xinshidawenquanxiaoqu

84

7
The national flag of China

Dabanchengquhuanbaoju

68

8
The national flag of China

Peixunjidi

30

City ranking

Real-time China AQI⁺ city ranking

#CitiesAQI⁺ US
1
The national flag of China

Kashgar, Xinjiang

154

2
The national flag of China

Jixi, Heilongjiang

147

3
The national flag of China

Qitaihe, Heilongjiang

128

4
The national flag of China

Urumqi, Xinjiang

127

5
The national flag of China

Meishan, Sichuan

117

6
The national flag of China

Qujing, Yunnan

113

7
The national flag of China

Kizilsu Kirghiz Autonomous Prefecture, Xinjiang

110

8
The national flag of China

Ziyang, Sichuan

105

9
The national flag of China

Chengdu, Sichuan

102

10
The national flag of China

Liangshan, Sichuan

102

Measure your own air quality

Get a monitor and contribute air quality data in your city.

What is the current air quality in Urumqi?

The current air quality in Urumqi is considered unhealthy for sensitive groups. Children, older adults, and people with heart or lung conditions may experience health effects, while the general public is less likely to be affected.

Is there a high level of air pollution in Urumqi?

Urumqi, previously known as both Dihua or Tihwa, is a city located in Xinjiang, a province found in the northwestern region of China, close to Central Asia. It has a long history going back many years as a prominent hub for the silk road and all related trade that took place on this historic route, and nowadays continues to see large amounts of activity taking place, with over 3.5 million inhabitants as of 2015, a number that will have grown significantly since this census was last taken.

In the latter days of April 2021, Urumqi was seen with a US AQI reading of 63 in the hours leading up to the afternoon, putting it in the ‘moderate’ ratings bracket for that particular time period. Whilst this is a fairly decent level of air quality (relatively speaking), and with many other prior days typically coming in with US AQI readings of around 47 all the way up to 118, with an average of around 70 being consistent between March and April, it can be seen that Urumqi received a very high placing on the worlds most polluted cities, and as such there are certain times of the year in which the pollution levels rise to significantly higher numbers, with some extreme readings being on record, which will be examined in short.

This higher reading of 118 was taken in mid-April, and would place it into the ‘unhealthy for sensitive groups’ bracket, which as the name suggests would harbor some danger for more vulnerable portions of the population. These include young children or babies, pregnant women, the elderly or infirm, as well as those with pre-existing health conditions or compromised immune systems.

Although this high of 118 pales in comparison to many other cities in Xinjiang province, as mentioned, the highs of pollution that come in certain months of the year are enough to skew its ratings enough to place it within the top 100 most polluted cities in the world, as of 2020. These US AQI readings are a composite number calculated by the levels of various pollutants found in the air, which include PM10, ozone (O3) and several others, also including PM2.5 which is also an important measure of pollution in its own right, with yearly averages often being calculated using PM2.5 levels.

This is due to the immensely small size it (PM2.5) can drop down to, being 2.5 micrometers or less, often going down many microns smaller. As well as this, it is comprised of a large amount of different materials with many adverse effects on human physiology, and can pass into the blood stream via the lungs due to its minute size.

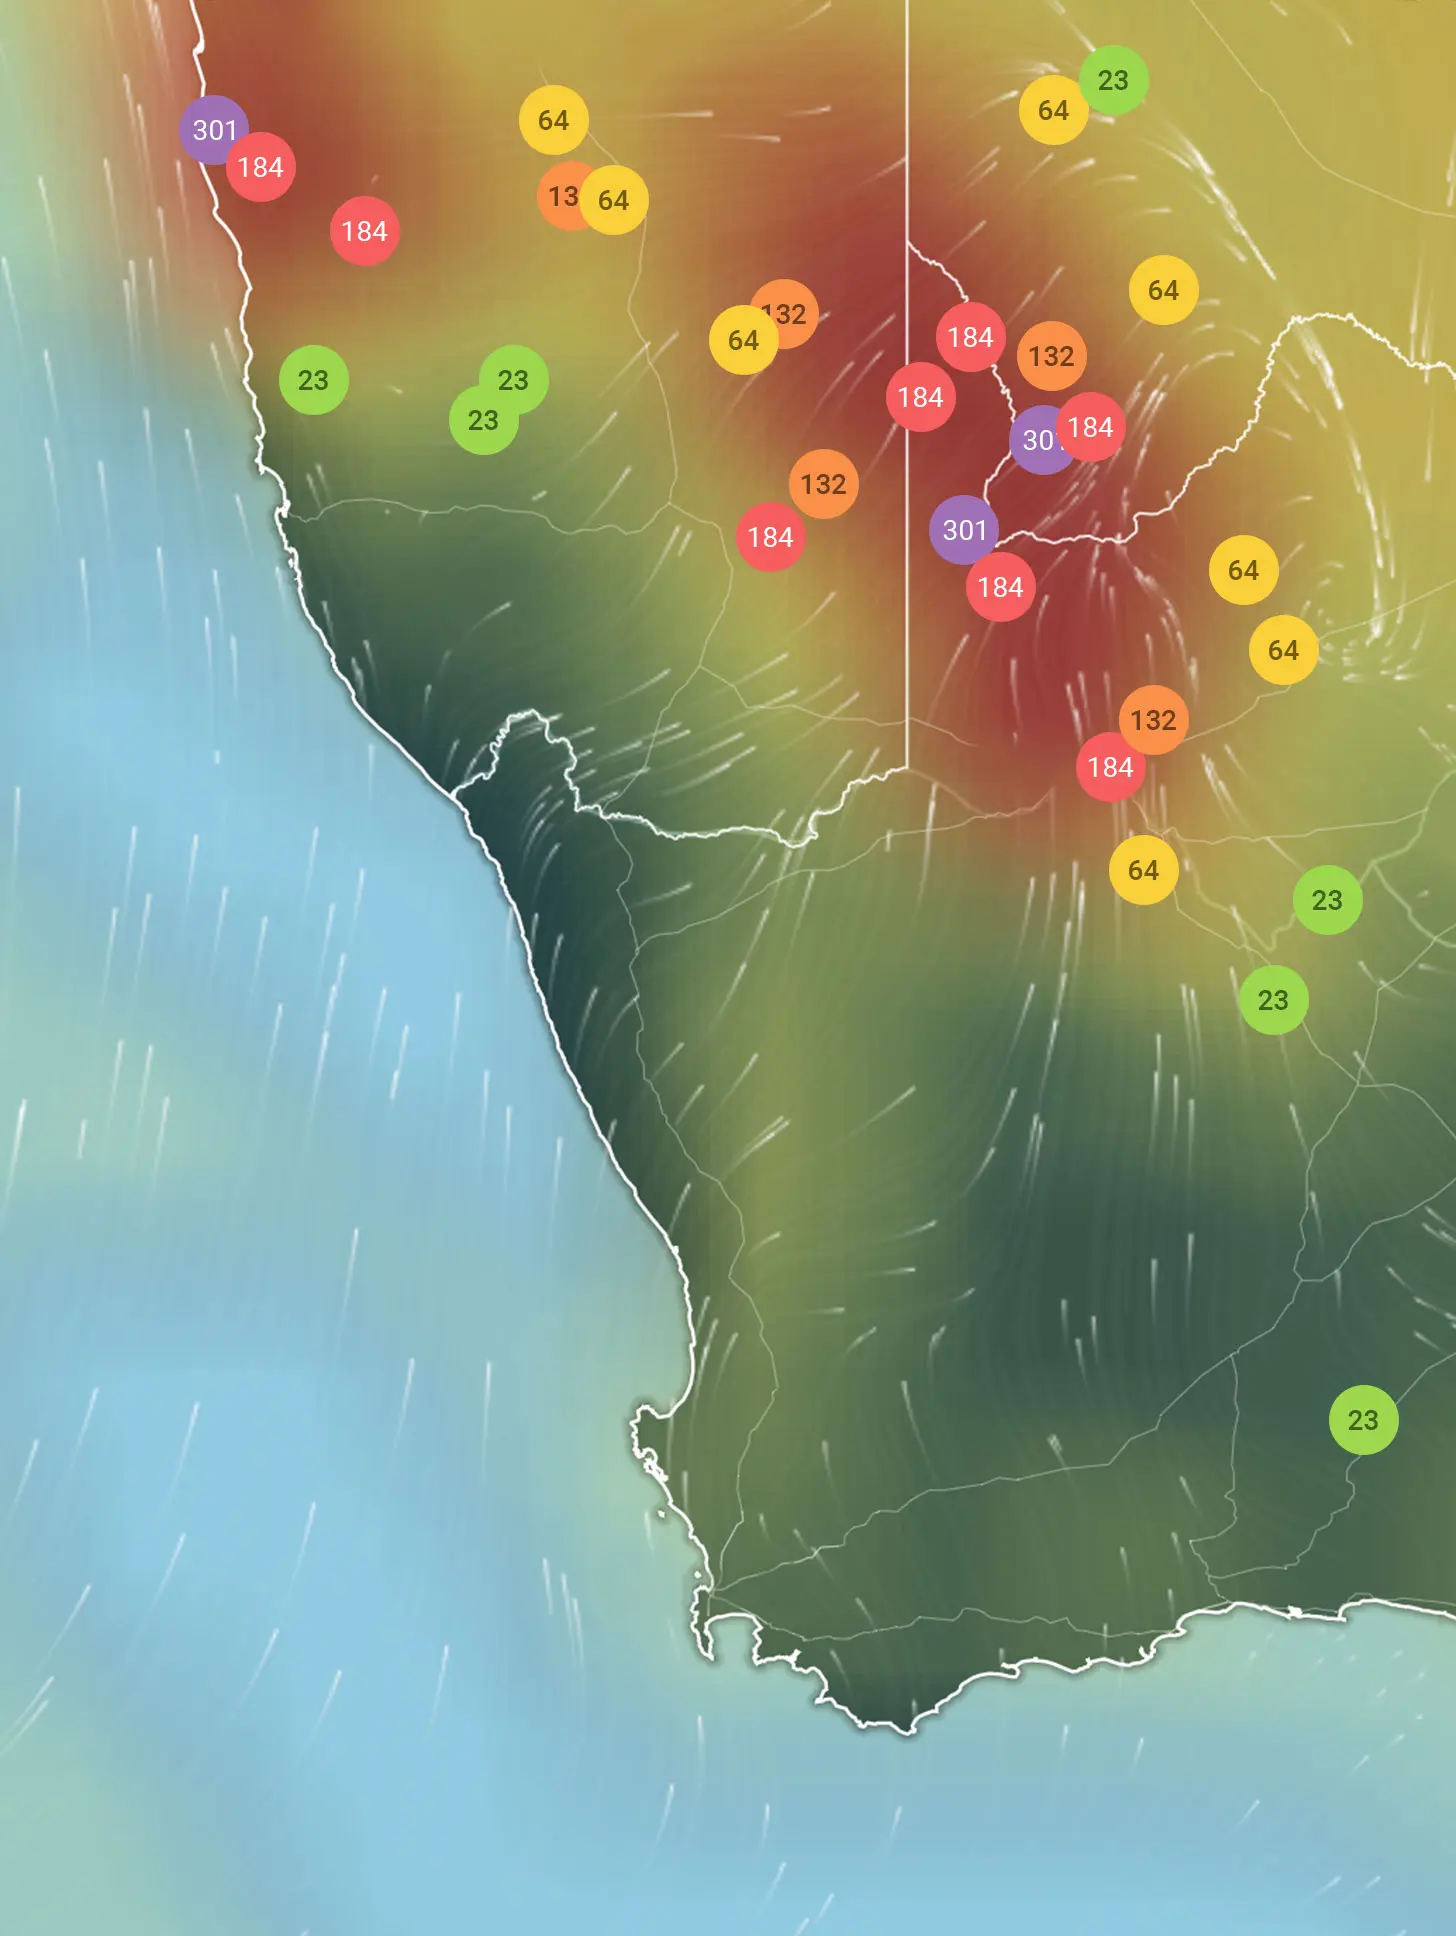
In closing, Urumqi is a city that sees many months of its year come in with decent levels of air pollution, and then is subject to rapid spikes which can be of immense danger to the health of its citizens. Preventative measures such as wearing fine particle filtering masks and avoiding outdoor activity would be well advised, particularly for vulnerable demographics. These air quality levels can be followed by the air quality map present at the top of this page, as well as via the AirVisual app.

What causes such high levels of air pollution in Urumqi?

Urumqi sees a large amount of its pollution come from various combustion sources, which include areas such as industrial sites, power plants and factories, all of which utilize large amounts of coal and other fossil fuels such as diesel or natural gas. Vehicles also play a role in heightened levels of smoke, haze and PM2.5 levels, often running on diesel fuels themselves (particularly larger freight vehicles such as trucks or lorries), which can lead to a large buildup of certain gases and other noxious pollutants in the air, which in turn can undergo chemical reactions under the right conditions to create new, or secondary pollutants.

Regarding the PM2.5 levels taken over the course of 2020, Urumqi came in with a reading of 51.2 μg/m³ as its yearly average, placing it in the ‘unhealthy for sensitive groups’ bracket, which requires a PM2.5 reading of anywhere between 35.5 to 55.4 μg/m³ to be classified as such. Besides being on the higher end of this rating, only a few units away from being moved into the ‘unhealthy’ ratings bracket which would require a reading of 55.5 μg/m³ or higher, Urumqi came in at 35th place out of all cities ranked in China over 2020, as well as in 93rd place out of all cities ranked worldwide.

In closing, other sources of pollution include dust blown in from outside regions, construction sites, the burning of wood or charcoal, demolition areas, poorly paved roads and any activity that disturbs large amounts of earth thus causing vast clouds of dust to be released. The main sources are industrial and vehicular activities.

When is the air quality at its worst in Urumqi?

Observing the data collected over 2020 once again, it can be seen that there were four distinct months out of the year in which the pollution levels were at their highest. These include January and February, as well as November and December. In order, they came in with PM2.5 readings of 138.8 μg/m³, 90.5 μg/m³, 45.2 μg/m³ and 161.8 μg/m³.

This made December the most polluted month of the year by a significant amount, with its reading of 161.8 placing it into the ‘very unhealthy’ air pollution bracket.

When does Urumqi see improvement in its air quality levels?

The months of March all the way through to October are when Urumqi has its best level of air quality, which as mentioned before, is prevalent throughout most of the year and distorted heavily by the extremely poor readings of pollution in the first and last two months of the year.

June, July and August all had the cleanest readings of PM2.5, coming in at 18.4 μg/m³, 17.6 μg/m³ and 12.8 μg/m³ respectively, making August the cleanest month of the year and very close to moving down to the ‘good’ ratings bracket, which requires a reading of 10 to 12 μg/m³.

What are the ill health effects of breathing polluted air in Urumqi?

Some side effects of breathing the air during the more polluted months of the year would be ones such as chronic obstructive pulmonary disease (COPD), an umbrella term which encompasses several respiratory ailments such as bronchitis and its various aggravated forms, asthma, emphysema and pneumonia. Cancer rates can also soar, along with strokes, heart attacks, ischemic heart disease and even damage to the reproductive system and thus a lowered fertility rate amongst the general population.