Air quality near Saskatoon Station, Saskatoon

Air quality index (AQI⁺) and PM2.5 air pollution near Saskatoon Station, Saskatoon • 5.1K Followers • 16:00, Apr 18 Local time

38

US AQI⁺

Good

face expression based on aqi value

Main pollutant:

O₃

94 µg/m³

weather condition icon

2°

wind direction icon

14 km/h

weather humid icon

80 %

Hourly forecast

Saskatoon Station, Saskatoon air quality index (AQI⁺) forecast

Now

38

Weather icon

IQAir AirVisual Air Quality Map Wind rotating 15 degree

14

km/h

Humidity icon

80%

19:00

38

Weather icon

IQAir AirVisual Air Quality Map Wind rotating 18 degree

11

km/h

Humidity icon

78%

20:00

38

Weather icon

-1°

IQAir AirVisual Air Quality Map Wind rotating 34 degree

8

km/h

Humidity icon

88%

21:00

39

Weather icon

-2°

IQAir AirVisual Air Quality Map Wind rotating 53 degree

6

km/h

Humidity icon

92%

22:00

38

Weather icon

-2°

IQAir AirVisual Air Quality Map Wind rotating 79 degree

5

km/h

Humidity icon

92%

23:00

37

Weather icon

-3°

IQAir AirVisual Air Quality Map Wind rotating 101 degree

3

km/h

Humidity icon

93%

Sun

00:00

36

Weather icon

-3°

IQAir AirVisual Air Quality Map Wind rotating 125 degree

3

km/h

Humidity icon

92%

01:00

33

Weather icon

-3°

IQAir AirVisual Air Quality Map Wind rotating 140 degree

3

km/h

Humidity icon

97%

02:00

29

Weather icon

-5°

IQAir AirVisual Air Quality Map Wind rotating 115 degree

4

km/h

Humidity icon

99%

03:00

24

Weather icon

-6°

IQAir AirVisual Air Quality Map Wind rotating 127 degree

4

km/h

Humidity icon

98%

04:00

24

Weather icon

-7°

IQAir AirVisual Air Quality Map Wind rotating 126 degree

4

km/h

Humidity icon

98%

05:00

26

Weather icon

-6°

IQAir AirVisual Air Quality Map Wind rotating 134 degree

5

km/h

Humidity icon

98%

06:00

28

Weather icon

-6°

IQAir AirVisual Air Quality Map Wind rotating 147 degree

6

km/h

Humidity icon

98%

07:00

29

Weather icon

-6°

IQAir AirVisual Air Quality Map Wind rotating 161 degree

8

km/h

Humidity icon

98%

08:00

31

Weather icon

-4°

IQAir AirVisual Air Quality Map Wind rotating 175 degree

11

km/h

Humidity icon

98%

09:00

33

Weather icon

-2°

IQAir AirVisual Air Quality Map Wind rotating 173 degree

12

km/h

Humidity icon

93%

10:00

33

Weather icon

IQAir AirVisual Air Quality Map Wind rotating 169 degree

14

km/h

Humidity icon

81%

11:00

33

Weather icon

IQAir AirVisual Air Quality Map Wind rotating 165 degree

16

km/h

Humidity icon

73%

12:00

34

Weather icon

IQAir AirVisual Air Quality Map Wind rotating 163 degree

19

km/h

Humidity icon

67%

13:00

33

Weather icon

IQAir AirVisual Air Quality Map Wind rotating 163 degree

20

km/h

Humidity icon

66%

14:00

32

Weather icon

IQAir AirVisual Air Quality Map Wind rotating 160 degree

20

km/h

Humidity icon

64%

15:00

32

Weather icon

IQAir AirVisual Air Quality Map Wind rotating 163 degree

22

km/h

Humidity icon

64%

16:00

31

Weather icon

IQAir AirVisual Air Quality Map Wind rotating 166 degree

24

km/h

Humidity icon

64%

17:00

31

Weather icon

IQAir AirVisual Air Quality Map Wind rotating 167 degree

24

km/h

Humidity icon

67%

18:00

31

Weather icon

IQAir AirVisual Air Quality Map Wind rotating 168 degree

22

km/h

Humidity icon

72%

19:00

29

Weather icon

IQAir AirVisual Air Quality Map Wind rotating 166 degree

20

km/h

Humidity icon

78%

20:00

27

Weather icon

IQAir AirVisual Air Quality Map Wind rotating 166 degree

21

km/h

Humidity icon

81%

21:00

26

Weather icon

IQAir AirVisual Air Quality Map Wind rotating 169 degree

20

km/h

Humidity icon

85%

22:00

24

Weather icon

IQAir AirVisual Air Quality Map Wind rotating 178 degree

19

km/h

Humidity icon

88%

23:00

23

Weather icon

IQAir AirVisual Air Quality Map Wind rotating 191 degree

19

km/h

Humidity icon

91%

Mon

00:00

22

Weather icon

IQAir AirVisual Air Quality Map Wind rotating 205 degree

18

km/h

Humidity icon

94%

01:00

21

Weather icon

IQAir AirVisual Air Quality Map Wind rotating 212 degree

15

km/h

Humidity icon

97%

02:00

20

Weather icon

IQAir AirVisual Air Quality Map Wind rotating 212 degree

12

km/h

Humidity icon

98%

03:00

19

Weather icon

IQAir AirVisual Air Quality Map Wind rotating 245 degree

10

km/h

Humidity icon

100%

04:00

19

Weather icon

IQAir AirVisual Air Quality Map Wind rotating 280 degree

11

km/h

Humidity icon

96%

05:00

19

Weather icon

IQAir AirVisual Air Quality Map Wind rotating 287 degree

12

km/h

Humidity icon

97%

06:00

19

Weather icon

IQAir AirVisual Air Quality Map Wind rotating 300 degree

12

km/h

Humidity icon

100%

07:00

18

Weather icon

IQAir AirVisual Air Quality Map Wind rotating 307 degree

15

km/h

Humidity icon

100%

08:00

18

Weather icon

IQAir AirVisual Air Quality Map Wind rotating 303 degree

16

km/h

Humidity icon

99%

09:00

18

Weather icon

IQAir AirVisual Air Quality Map Wind rotating 298 degree

15

km/h

Humidity icon

96%

10:00

15

Weather icon

IQAir AirVisual Air Quality Map Wind rotating 303 degree

17

km/h

Humidity icon

86%

11:00

12

Weather icon

IQAir AirVisual Air Quality Map Wind rotating 299 degree

17

km/h

Humidity icon

74%

12:00

10

Weather icon

IQAir AirVisual Air Quality Map Wind rotating 302 degree

21

km/h

Humidity icon

62%

13:00

8

Weather icon

10°

IQAir AirVisual Air Quality Map Wind rotating 296 degree

19

km/h

Humidity icon

58%

14:00

7

Weather icon

11°

IQAir AirVisual Air Quality Map Wind rotating 293 degree

18

km/h

Humidity icon

53%

15:00

6

Weather icon

12°

IQAir AirVisual Air Quality Map Wind rotating 293 degree

17

km/h

Humidity icon

47%

16:00

6

Weather icon

13°

IQAir AirVisual Air Quality Map Wind rotating 292 degree

14

km/h

Humidity icon

44%

17:00

6

Weather icon

13°

IQAir AirVisual Air Quality Map Wind rotating 287 degree

11

km/h

Humidity icon

45%

18:00

6

Weather icon

13°

IQAir AirVisual Air Quality Map Wind rotating 270 degree

7

km/h

Humidity icon

49%

19:00

6

Weather icon

IQAir AirVisual Air Quality Map Wind rotating 60 degree

9

km/h

Humidity icon

64%

20:00

6

Weather icon

IQAir AirVisual Air Quality Map Wind rotating 92 degree

11

km/h

Humidity icon

68%

21:00

6

Weather icon

IQAir AirVisual Air Quality Map Wind rotating 118 degree

13

km/h

Humidity icon

73%

22:00

6

Weather icon

IQAir AirVisual Air Quality Map Wind rotating 126 degree

16

km/h

Humidity icon

81%

23:00

6

Weather icon

IQAir AirVisual Air Quality Map Wind rotating 135 degree

18

km/h

Humidity icon

84%

Tue

00:00

6

Weather icon

IQAir AirVisual Air Quality Map Wind rotating 143 degree

19

km/h

Humidity icon

84%

01:00

6

Weather icon

IQAir AirVisual Air Quality Map Wind rotating 146 degree

18

km/h

Humidity icon

84%

02:00

6

Weather icon

IQAir AirVisual Air Quality Map Wind rotating 145 degree

15

km/h

Humidity icon

85%

03:00

6

Weather icon

IQAir AirVisual Air Quality Map Wind rotating 141 degree

16

km/h

Humidity icon

86%

04:00

6

Weather icon

IQAir AirVisual Air Quality Map Wind rotating 132 degree

16

km/h

Humidity icon

86%

05:00

6

Weather icon

IQAir AirVisual Air Quality Map Wind rotating 131 degree

19

km/h

Humidity icon

82%

06:00

6

Weather icon

IQAir AirVisual Air Quality Map Wind rotating 134 degree

20

km/h

Humidity icon

82%

07:00

6

Weather icon

IQAir AirVisual Air Quality Map Wind rotating 140 degree

19

km/h

Humidity icon

80%

08:00

6

Weather icon

IQAir AirVisual Air Quality Map Wind rotating 147 degree

17

km/h

Humidity icon

75%

09:00

7

Weather icon

IQAir AirVisual Air Quality Map Wind rotating 159 degree

15

km/h

Humidity icon

67%

10:00

6

Weather icon

11°

IQAir AirVisual Air Quality Map Wind rotating 175 degree

11

km/h

Humidity icon

61%

11:00

6

Weather icon

13°

IQAir AirVisual Air Quality Map Wind rotating 174 degree

7

km/h

Humidity icon

57%

12:00

6

Weather icon

14°

IQAir AirVisual Air Quality Map Wind rotating 270 degree

1

km/h

Humidity icon

53%

13:00

6

Weather icon

15°

IQAir AirVisual Air Quality Map Wind rotating 14 degree

7

km/h

Humidity icon

51%

14:00

6

Weather icon

16°

IQAir AirVisual Air Quality Map Wind rotating 23 degree

9

km/h

Humidity icon

50%

15:00

6

Weather icon

17°

IQAir AirVisual Air Quality Map Wind rotating 20 degree

11

km/h

Humidity icon

51%

16:00

6

Weather icon

17°

IQAir AirVisual Air Quality Map Wind rotating 20 degree

15

km/h

Humidity icon

55%

17:00

7

Weather icon

16°

IQAir AirVisual Air Quality Map Wind rotating 26 degree

15

km/h

Humidity icon

60%

Daily forecast

|

Saskatoon Station, Saskatoon air quality index (AQI⁺) forecast

Today

33

Weather icon

-6°

IQAir AirVisual Air Quality Map Wind rotating 180 degree

24

km/h

Humidity icon

79%

Sun

19

Weather icon

13°

IQAir AirVisual Air Quality Map Wind rotating 315 degree

21

km/h

Humidity icon

70%

Mon

7

Weather icon

17°

IQAir AirVisual Air Quality Map Wind rotating 45 degree

20

km/h

Humidity icon

66%

Air pollutants

What is the current air quality near Saskatoon Station?

IQAir Check icon

PM2.5 concentration currently meets the WHO annual PM2.5 guideline.

Health recommendations

common.healthRecommendationComp.icons.exerciseAlt

Enjoy outdoor activities

common.healthRecommendationComp.icons.windowAlt

Open your windows to bring clean, fresh air indoors

Get a monitor

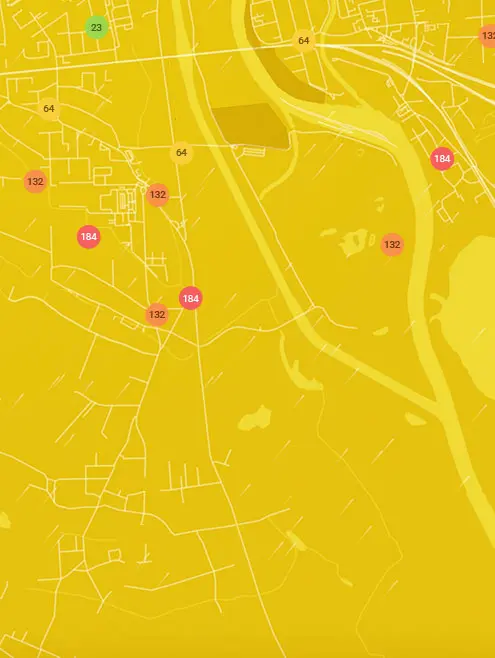
Real-time Saskatoon Station, Saskatoon air pollution map

Pollen

What is the pollen count in Saskatoon Station today?

Index

Pollen global icon

Low

Pollen tree icon

Tree

Low

25%
Pollen grass icon

Grass

Low

25%
Pollen weed icon

Weed

None

0%

Source:

wetter.com
Pollen forecast

Pollen

What is the pollen count in Saskatoon Station today?

Index

Pollen global icon

Low

Pollen tree icon

Tree

Low

25%
Pollen grass icon

Grass

Low

25%
Pollen weed icon

Weed

None

0%

Source:

wetter.com
Pollen forecast

History

Historic air quality graph for Saskatoon Station

38 AQI⁺ US
Good
15:00–16:00 Apr 18 Local time
AQI⁺ US

Measure your own air quality

Get a monitor and contribute air quality data in your city.

Most polluted locations near Saskatoon Station, Saskatoon

Worldwide AQI⁺ rankingarrow right icon

Station ranking

Real-time Saskatoon Station AQI⁺ station ranking

#StationsAQI⁺ US
1
The national flag of Canada

Saskatoon Station

38

2
The national flag of Canada

Downtown

35

3
The national flag of Canada

Eastview

31

4
The national flag of Canada

Lawson Heights Suburban Centre

31

5
The national flag of Canada

Wildwood

31

6
The national flag of Canada

Greystone Heights

30

7
The national flag of Canada

Nutana Suburban Centre

28

8
The national flag of Canada

4th Ave

17

City ranking

Real-time Canada AQI⁺ city ranking

#CitiesAQI⁺ US
1
The national flag of Canada

Grimshaw, Alberta

47

2
The national flag of Canada

Leduc, Alberta

47

3
The national flag of Canada

Medicine Hat, Alberta

43

4
The national flag of Canada

Calgary, Alberta

42

5
The national flag of Canada

High Prairie, Alberta

42

6
The national flag of Canada

Penticton, British Columbia

42

7
The national flag of Canada

Airdrie, Alberta

41

8
The national flag of Canada

Gatineau, Quebec

41

9
The national flag of Canada

Cochrane, Alberta

40

10
The national flag of Canada

Fort Mckay, Alberta

39

Download our Air Quality App

Download AirVisual app on App StoreDownload AirVisual app on Android

What is the air quality of Saskatoon?

Saskatoon is a city located in the province of Saskatchewan, being the largest city in the region and home to over 246 thousand inhabitants (a number taken from a census conducted in 2016 and thus will have grown since then). The province of Saskatchewan itself is full of large amounts of forested areas, nature reserves and fresh water bodies, having over 100 thousand lakes. It has a history of being set up as a ‘dry’ community, meaning that its early settlers were against the consumption of alcohol, historically being known as a temperance colony.

Nowadays, Saskatoon sees a large amount of its economy based around the production or extraction of materials such as potash or oil, as well as the mining of rare or precious goods such as gold, diamond uranium and coal. There is also a growing scene in the IT and digital media industry, another factor that can draw people towards living and working within the city. Whilst they are all important drivers in the city’s economy, they can also have a negative impact on the quality of air.

In 2019, Saskatoon came in with a PM2.5 reading of 8.2 μg/m³ as its yearly average. This is a respectable reading that placed Saskatoon within the World Health Organizations (WHO's) target goal of 10 μg/m³ or less for the best quality of air. This reading placed the city in 3309th place out of all cities ranked worldwide, as well as 41st place out of all cities ranked in Canada. Whilst this still represents a great quality of air for the city, it could certainly stand to improve its PM2.5 readings further, considering that Canadian cities hold some of the best air quality in the world, with many of its cities coming in with considerably cleaner readings.

What are some causes of polluted air in Saskatoon?

Saskatoon has numerous causes of air pollution occurring within the city limits, and as mentioned whilst Canadian cities tend to have some of the best air quality in the world (with Canada ranking in at 90th place out of all 98 countries ranked worldwide in 2019), they are still not exempt from the polluting effects of industry and the mass movement of people in their daily lives.

One of the most prominent causes of air pollution within Saskatoon would stem from vehicle exhaust and emission fumes. With a vast amount of people on the road at any given time, as well as increasing vehicle ownership as time goes on, there would be a large amount of cars, motorbikes and other smaller personal vehicles inhabiting the road, giving out large amounts of noxious chemicals and fine particulate matter.

In regards to industry, particularly for the import and export side of things, the use of heavy duty vehicles is required. These include ones such as trucks and lorries, vehicles that are above a certain size and weight and often run on diesel fuels. These can put out far greater amounts of pollution than a singular vehicle of a smaller size would, as well as giving off huge amounts of finely ground rubber particles, which can wreak havoc on both wildlife and human health when respired.

Other pertinent sources would be construction sites, road repairs, the formation of secondary pollutants in the atmosphere, as well as factory or power plant emissions, and even the burning of firewood or charcoal during the colder winter months.

When is the air quality at its most polluted in Saskatoon?

Observing the air quality data gathered over the course of 2019, Saskatoon showed a period of time where the air pollution levels were significantly higher. These elevations in pollution typically correlate with the colder months, although there can be exceptions due to other occurrences such as forest fires or other polluting events taking place throughout the year.

Towards the end of the year is when these higher numbers started to make themselves apparent, with the month of November still maintaining a respectable PM2.5 reading of 6.1 μg/m³. This then jumped significantly up to 9 μg/m³ in December, showing the Saskatoon had entered into its time period of higher pollution levels.

This continued on into the early months of the following year, with readings that remained high all the way through to May. January through to May all came in with readings of 8.2 μg/m³, 8.9 μg/m³, 10.3 μg/m³, 9 μg/m³ and 9.1 μg/m³ respectively, making March the most polluted month of the year at 10.3 μg/m³, and the only month to break into the ‘good’ air quality ratings bracket (10 to 12 μg/m³ required for classification). In closing, the months of December through to March of the following year are when Saskatoon displayed its highest levels of air pollution.

When is the air quality at its cleanest in Saskatoon?

Continuing on from the previous question, after the period of time when there was a higher level of air pollution present, once it began to abate, there were other months that showed significantly improved levels of air quality. With the month of March coming in with its reading of 9.1 μg/m³, the following month of June came in with a lesser reading of 7.5 μg/m³, after which the PM2.5 continued to drop.

The months of July through to November where the cleanest out of the year for Saskatoon in 2019, with readings of 6.5 μg/m³, 6.5 μg/m³, 5 μg/m³, 6 μg/m³ and 6.1 μg/m³ respectively, making September the cleanest month of the year with its reading of 5 μg/m³, less than half of the most polluted month of the year (March at 10.3 μg/m³).

What are some of the main pollutants found in the air in Saskatoon?

The main pollutants found in the air would be ones mostly emanating from vehicles. These include chemicals such as nitrogen dioxide (NO2) and sulfur dioxide (SO2), with nitrogen dioxide being the biggest offender in terms of its release from vehicles. The various oxides of nitrogen (NOx) can also linger in the atmosphere and convert into one of the most prevalent forms of pollution found in Saskatoon, namely ozone (O3).

This is formed when the aforementioned oxides of nitrogen (among other chemicals) get exposed to solar radiation and convert into ozone, or smog as it is known when it accumulates in larger amounts. These would be a few of the main pollutants found in the air in Saskatoon.